Zip Codes with the Highest Percentage of Population Employed in Architecture & Engineering in Anderson, SC
RELATED REPORTS & OPTIONS
Architecture & Engineering
Anderson
Compare Zip Codes
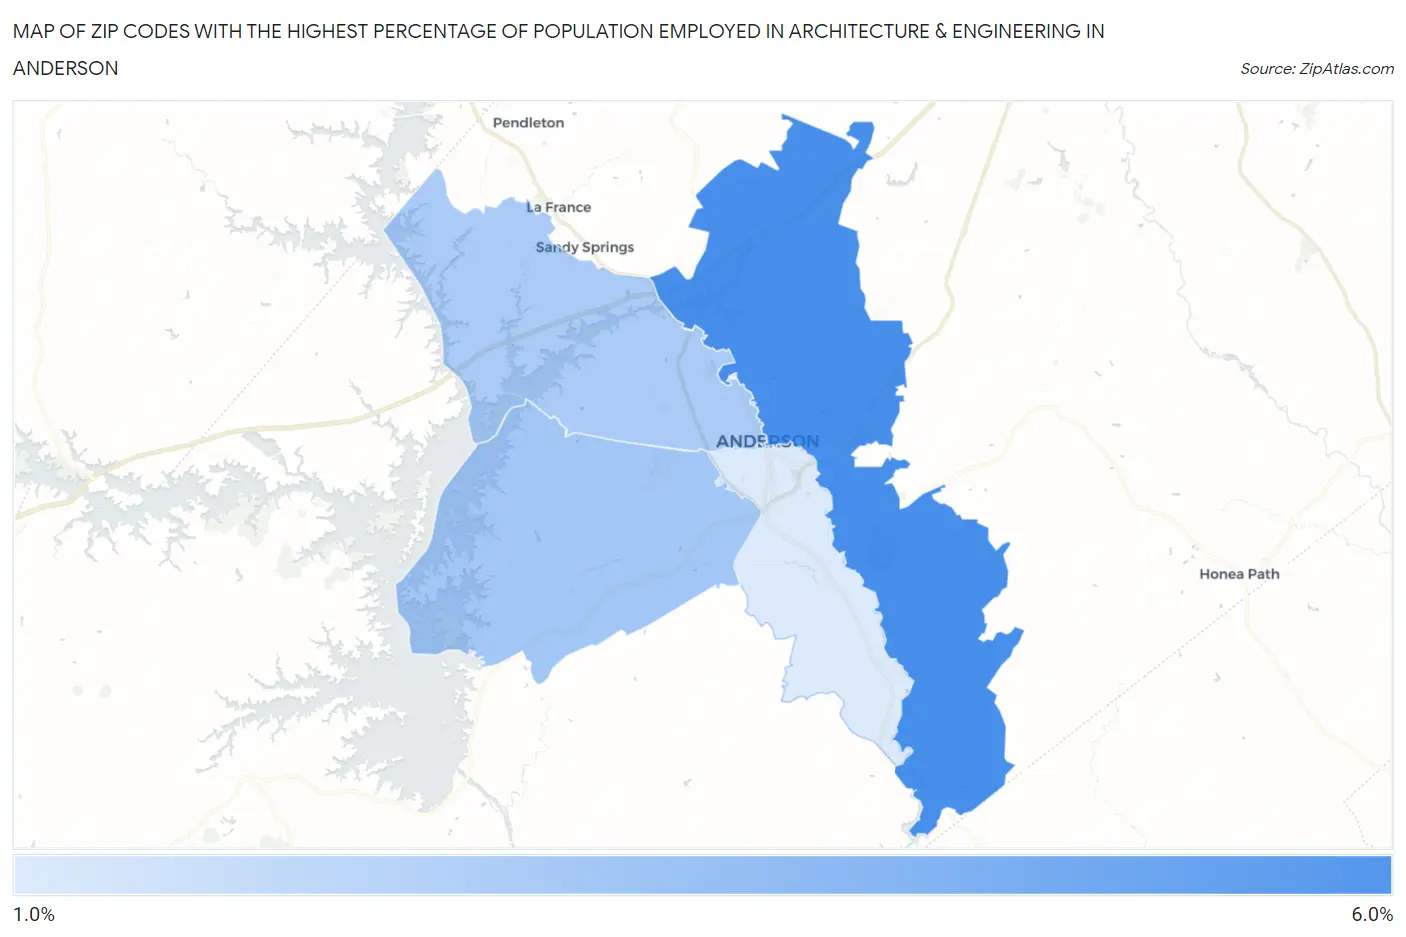
Map of Zip Codes with the Highest Percentage of Population Employed in Architecture & Engineering in Anderson
1.4%
5.7%
Zip Codes with the Highest Percentage of Population Employed in Architecture & Engineering in Anderson, SC
| Zip Code | % Employed | vs State | vs National | |
| 1. | 29621 | 5.7% | 2.2%(+3.48)#13 | 2.1%(+3.53)#1,229 |
| 2. | 29626 | 3.0% | 2.2%(+0.819)#69 | 2.1%(+0.866)#5,006 |
| 3. | 29625 | 2.8% | 2.2%(+0.629)#81 | 2.1%(+0.676)#5,683 |
| 4. | 29624 | 1.4% | 2.2%(-0.797)#181 | 2.1%(-0.750)#13,590 |
1
Common Questions
What are the Top 3 Zip Codes with the Highest Percentage of Population Employed in Architecture & Engineering in Anderson, SC?
Top 3 Zip Codes with the Highest Percentage of Population Employed in Architecture & Engineering in Anderson, SC are:
What zip code has the Highest Percentage of Population Employed in Architecture & Engineering in Anderson, SC?
29621 has the Highest Percentage of Population Employed in Architecture & Engineering in Anderson, SC with 5.7%.
What is the Percentage of Population Employed in Architecture & Engineering in Anderson, SC?
Percentage of Population Employed in Architecture & Engineering in Anderson is 3.4%.
What is the Percentage of Population Employed in Architecture & Engineering in South Carolina?
Percentage of Population Employed in Architecture & Engineering in South Carolina is 2.2%.
What is the Percentage of Population Employed in Architecture & Engineering in the United States?
Percentage of Population Employed in Architecture & Engineering in the United States is 2.1%.