Zip Codes with the Highest Percentage of Population Employed in Architecture & Engineering in North Charleston, SC
RELATED REPORTS & OPTIONS
Architecture & Engineering
North Charleston
Compare Zip Codes
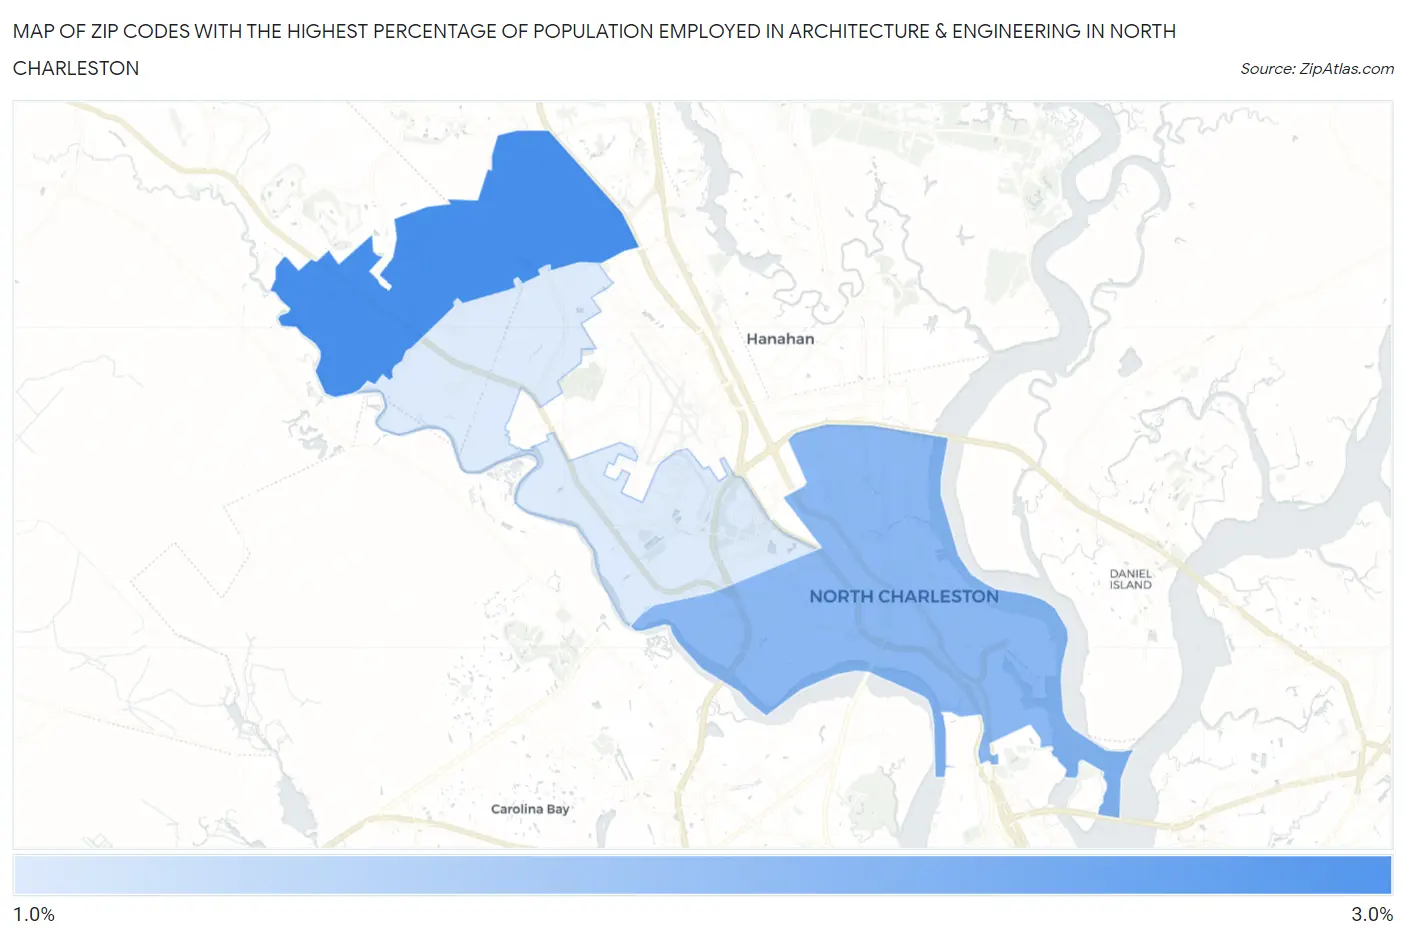
Map of Zip Codes with the Highest Percentage of Population Employed in Architecture & Engineering in North Charleston
1.4%
2.5%
Zip Codes with the Highest Percentage of Population Employed in Architecture & Engineering in North Charleston, SC
| Zip Code | % Employed | vs State | vs National | |
| 1. | 29420 | 2.5% | 2.2%(+0.326)#97 | 2.1%(+0.373)#6,896 |
| 2. | 29405 | 2.0% | 2.2%(-0.182)#127 | 2.1%(-0.135)#9,525 |
| 3. | 29418 | 1.4% | 2.2%(-0.812)#185 | 2.1%(-0.765)#13,699 |
1
Common Questions
What are the Top Zip Codes with the Highest Percentage of Population Employed in Architecture & Engineering in North Charleston, SC?
Top Zip Codes with the Highest Percentage of Population Employed in Architecture & Engineering in North Charleston, SC are:
What zip code has the Highest Percentage of Population Employed in Architecture & Engineering in North Charleston, SC?
29420 has the Highest Percentage of Population Employed in Architecture & Engineering in North Charleston, SC with 2.5%.
What is the Percentage of Population Employed in Architecture & Engineering in North Charleston, SC?
Percentage of Population Employed in Architecture & Engineering in North Charleston is 2.3%.
What is the Percentage of Population Employed in Architecture & Engineering in South Carolina?
Percentage of Population Employed in Architecture & Engineering in South Carolina is 2.2%.
What is the Percentage of Population Employed in Architecture & Engineering in the United States?
Percentage of Population Employed in Architecture & Engineering in the United States is 2.1%.