Zip Codes with the Highest Percentage of Population Employed in Architecture & Engineering in Beaufort, SC
RELATED REPORTS & OPTIONS
Architecture & Engineering
Beaufort
Compare Zip Codes
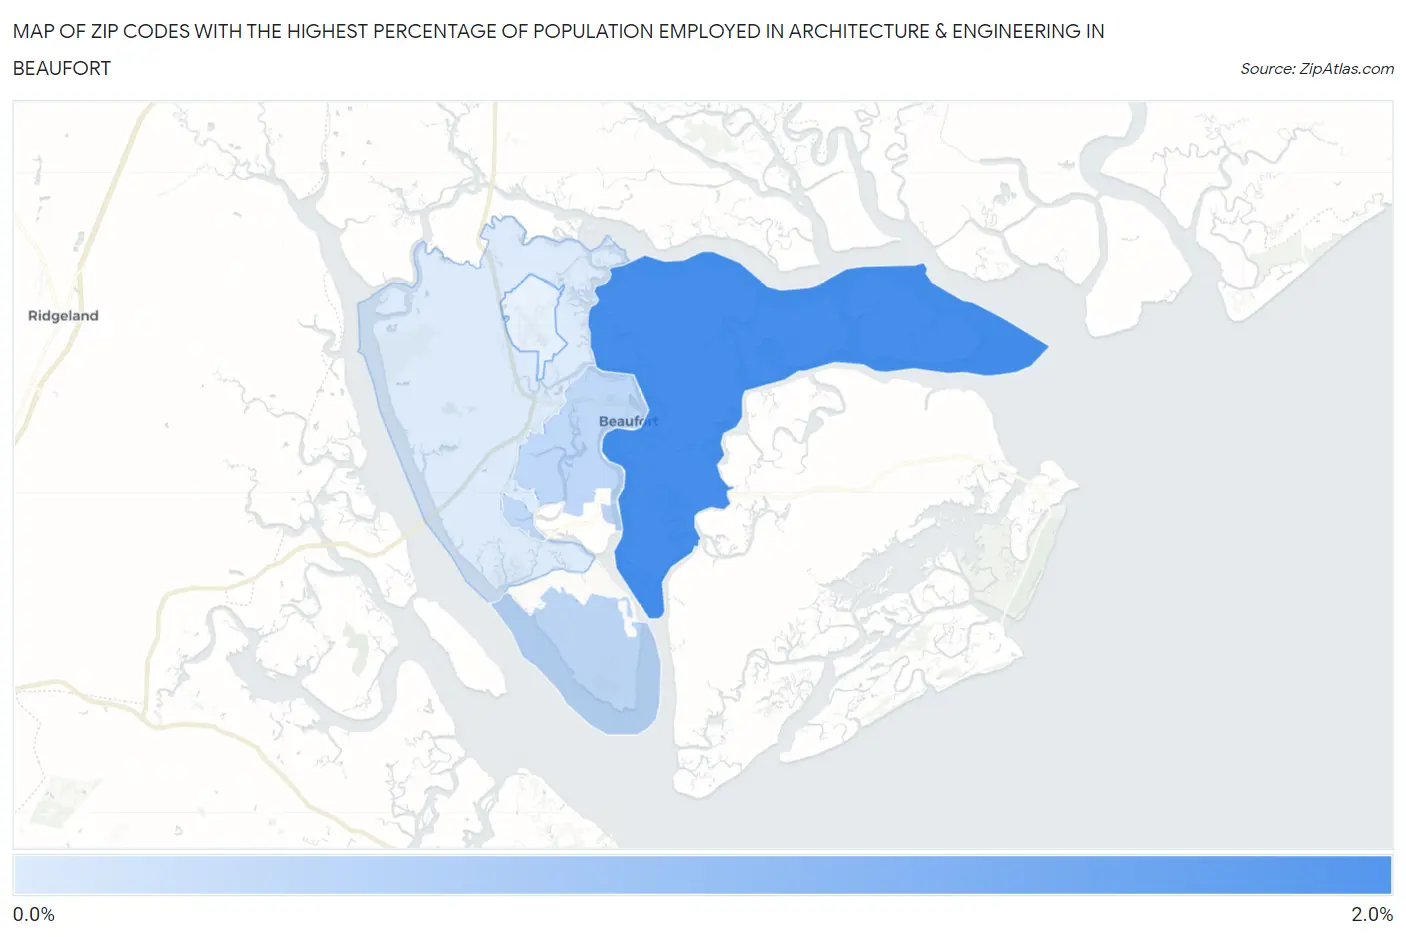
Map of Zip Codes with the Highest Percentage of Population Employed in Architecture & Engineering in Beaufort
0.70%
2.0%
Zip Codes with the Highest Percentage of Population Employed in Architecture & Engineering in Beaufort, SC
| Zip Code | % Employed | vs State | vs National | |
| 1. | 29907 | 2.0% | 2.2%(-0.224)#134 | 2.1%(-0.177)#9,786 |
| 2. | 29902 | 0.96% | 2.2%(-1.23)#225 | 2.1%(-1.19)#16,910 |
| 3. | 29906 | 0.70% | 2.2%(-1.49)#262 | 2.1%(-1.45)#18,869 |
1
Common Questions
What are the Top 3 Zip Codes with the Highest Percentage of Population Employed in Architecture & Engineering in Beaufort, SC?
Top 3 Zip Codes with the Highest Percentage of Population Employed in Architecture & Engineering in Beaufort, SC are:
What zip code has the Highest Percentage of Population Employed in Architecture & Engineering in Beaufort, SC?
29907 has the Highest Percentage of Population Employed in Architecture & Engineering in Beaufort, SC with 2.0%.
What is the Percentage of Population Employed in Architecture & Engineering in Beaufort, SC?
Percentage of Population Employed in Architecture & Engineering in Beaufort is 1.3%.
What is the Percentage of Population Employed in Architecture & Engineering in South Carolina?
Percentage of Population Employed in Architecture & Engineering in South Carolina is 2.2%.
What is the Percentage of Population Employed in Architecture & Engineering in the United States?
Percentage of Population Employed in Architecture & Engineering in the United States is 2.1%.