Tlingit-Haida vs Osage Married-Couple Family Poverty
COMPARE
Tlingit-Haida
Osage
Married-Couple Family Poverty
Married-Couple Family Poverty Comparison
Tlingit-Haida
Osage
4.4%
MARRIED-COUPLE FAMILY POVERTY
99.6/ 100
METRIC RATING
60th/ 347
METRIC RANK
5.4%
MARRIED-COUPLE FAMILY POVERTY
18.4/ 100
METRIC RATING
206th/ 347
METRIC RANK
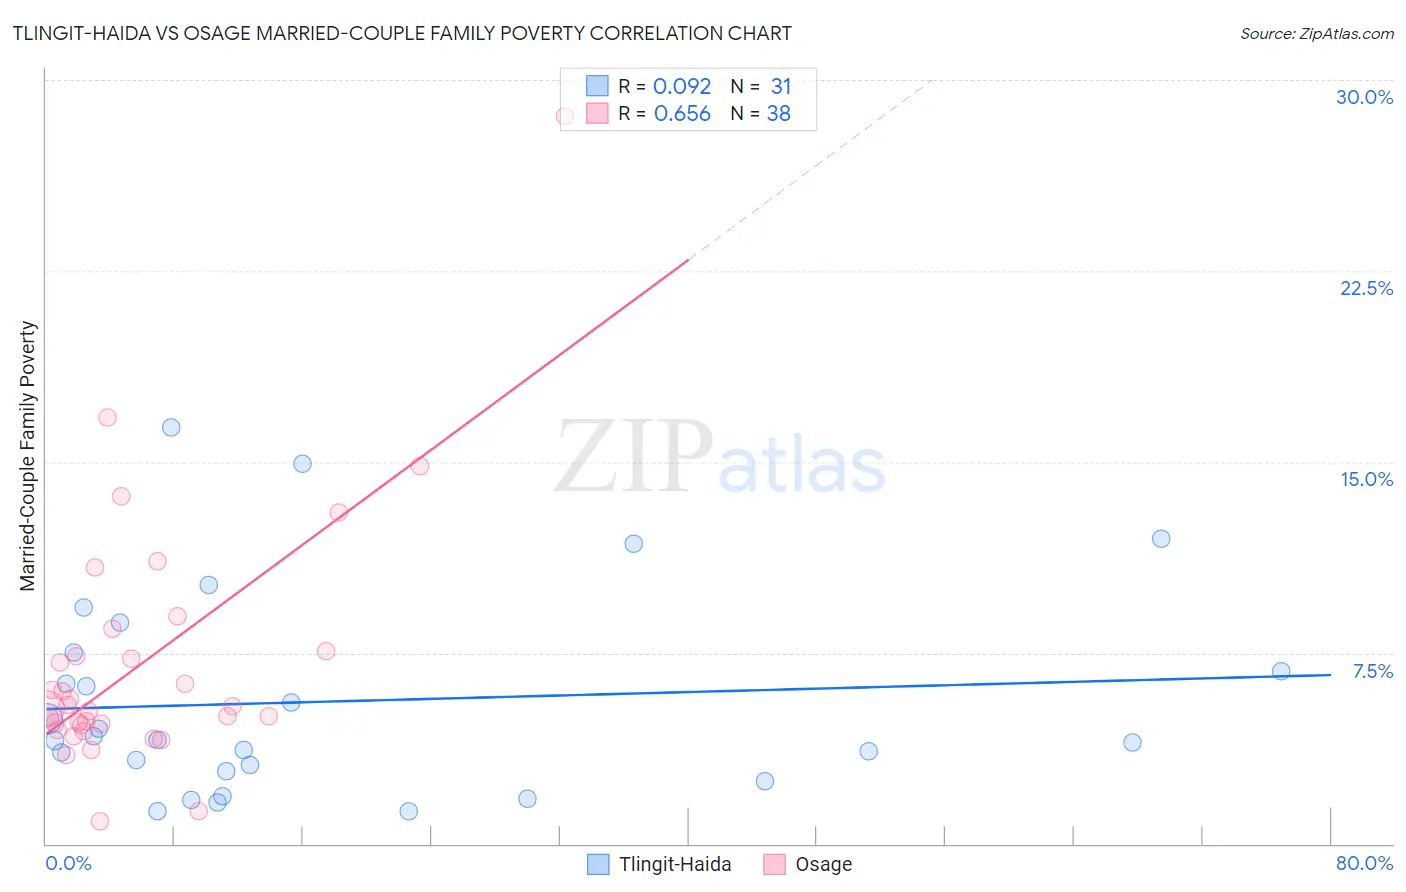
Tlingit-Haida vs Osage Married-Couple Family Poverty Correlation Chart
The statistical analysis conducted on geographies consisting of 60,624,230 people shows a slight positive correlation between the proportion of Tlingit-Haida and poverty level among married-couple families in the United States with a correlation coefficient (R) of 0.092 and weighted average of 4.4%. Similarly, the statistical analysis conducted on geographies consisting of 91,686,169 people shows a significant positive correlation between the proportion of Osage and poverty level among married-couple families in the United States with a correlation coefficient (R) of 0.656 and weighted average of 5.4%, a difference of 24.4%.
Married-Couple Family Poverty Correlation Summary
| Measurement | Tlingit-Haida | Osage |
| Minimum | 1.3% | 0.88% |
| Maximum | 16.3% | 28.6% |
| Range | 15.1% | 27.7% |
| Mean | 5.6% | 7.1% |
| Median | 4.1% | 5.3% |
| Interquartile 25% (IQ1) | 2.8% | 4.7% |
| Interquartile 75% (IQ3) | 7.5% | 7.6% |
| Interquartile Range (IQR) | 4.7% | 2.9% |
| Standard Deviation (Sample) | 4.0% | 5.0% |
| Standard Deviation (Population) | 3.9% | 4.9% |
Similar Demographics by Married-Couple Family Poverty
Demographics Similar to Tlingit-Haida by Married-Couple Family Poverty
In terms of married-couple family poverty, the demographic groups most similar to Tlingit-Haida are Immigrants from Sweden (4.4%, a difference of 0.070%), Okinawan (4.4%, a difference of 0.11%), Immigrants from Australia (4.4%, a difference of 0.12%), Immigrants from Sri Lanka (4.4%, a difference of 0.49%), and Czechoslovakian (4.4%, a difference of 0.62%).
| Demographics | Rating | Rank | Married-Couple Family Poverty |
| Welsh | 99.7 /100 | #53 | Exceptional 4.3% |
| Austrians | 99.7 /100 | #54 | Exceptional 4.3% |
| French | 99.7 /100 | #55 | Exceptional 4.3% |
| Immigrants | Zimbabwe | 99.7 /100 | #56 | Exceptional 4.3% |
| Immigrants | Netherlands | 99.7 /100 | #57 | Exceptional 4.3% |
| Czechoslovakians | 99.7 /100 | #58 | Exceptional 4.4% |
| Immigrants | Sweden | 99.6 /100 | #59 | Exceptional 4.4% |
| Tlingit-Haida | 99.6 /100 | #60 | Exceptional 4.4% |
| Okinawans | 99.6 /100 | #61 | Exceptional 4.4% |
| Immigrants | Australia | 99.6 /100 | #62 | Exceptional 4.4% |
| Immigrants | Sri Lanka | 99.6 /100 | #63 | Exceptional 4.4% |
| Immigrants | Bulgaria | 99.5 /100 | #64 | Exceptional 4.4% |
| Macedonians | 99.4 /100 | #65 | Exceptional 4.4% |
| Immigrants | Serbia | 99.4 /100 | #66 | Exceptional 4.4% |
| Immigrants | Canada | 99.4 /100 | #67 | Exceptional 4.4% |
Demographics Similar to Osage by Married-Couple Family Poverty
In terms of married-couple family poverty, the demographic groups most similar to Osage are Chippewa (5.4%, a difference of 0.10%), Immigrants from Africa (5.5%, a difference of 0.14%), Immigrants from Costa Rica (5.4%, a difference of 0.19%), French American Indian (5.5%, a difference of 0.45%), and Immigrants from Syria (5.5%, a difference of 0.59%).
| Demographics | Rating | Rank | Married-Couple Family Poverty |
| Uruguayans | 25.0 /100 | #199 | Fair 5.4% |
| Immigrants | Morocco | 24.3 /100 | #200 | Fair 5.4% |
| Lebanese | 24.1 /100 | #201 | Fair 5.4% |
| Immigrants | Middle Africa | 23.8 /100 | #202 | Fair 5.4% |
| Immigrants | Peru | 21.8 /100 | #203 | Fair 5.4% |
| Immigrants | Costa Rica | 19.4 /100 | #204 | Poor 5.4% |
| Chippewa | 18.9 /100 | #205 | Poor 5.4% |
| Osage | 18.4 /100 | #206 | Poor 5.4% |
| Immigrants | Africa | 17.6 /100 | #207 | Poor 5.5% |
| French American Indians | 16.1 /100 | #208 | Poor 5.5% |
| Immigrants | Syria | 15.4 /100 | #209 | Poor 5.5% |
| Immigrants | Micronesia | 14.4 /100 | #210 | Poor 5.5% |
| Nigerians | 14.3 /100 | #211 | Poor 5.5% |
| Immigrants | Thailand | 14.0 /100 | #212 | Poor 5.5% |
| Immigrants | Liberia | 13.3 /100 | #213 | Poor 5.5% |