Syrian vs Immigrants from Laos Median Household Income
COMPARE
Syrian
Immigrants from Laos
Median Household Income
Median Household Income Comparison
Syrians
Immigrants from Laos
$89,830
MEDIAN HOUSEHOLD INCOME
95.4/ 100
METRIC RATING
118th/ 347
METRIC RANK
$78,327
MEDIAN HOUSEHOLD INCOME
1.3/ 100
METRIC RATING
250th/ 347
METRIC RANK
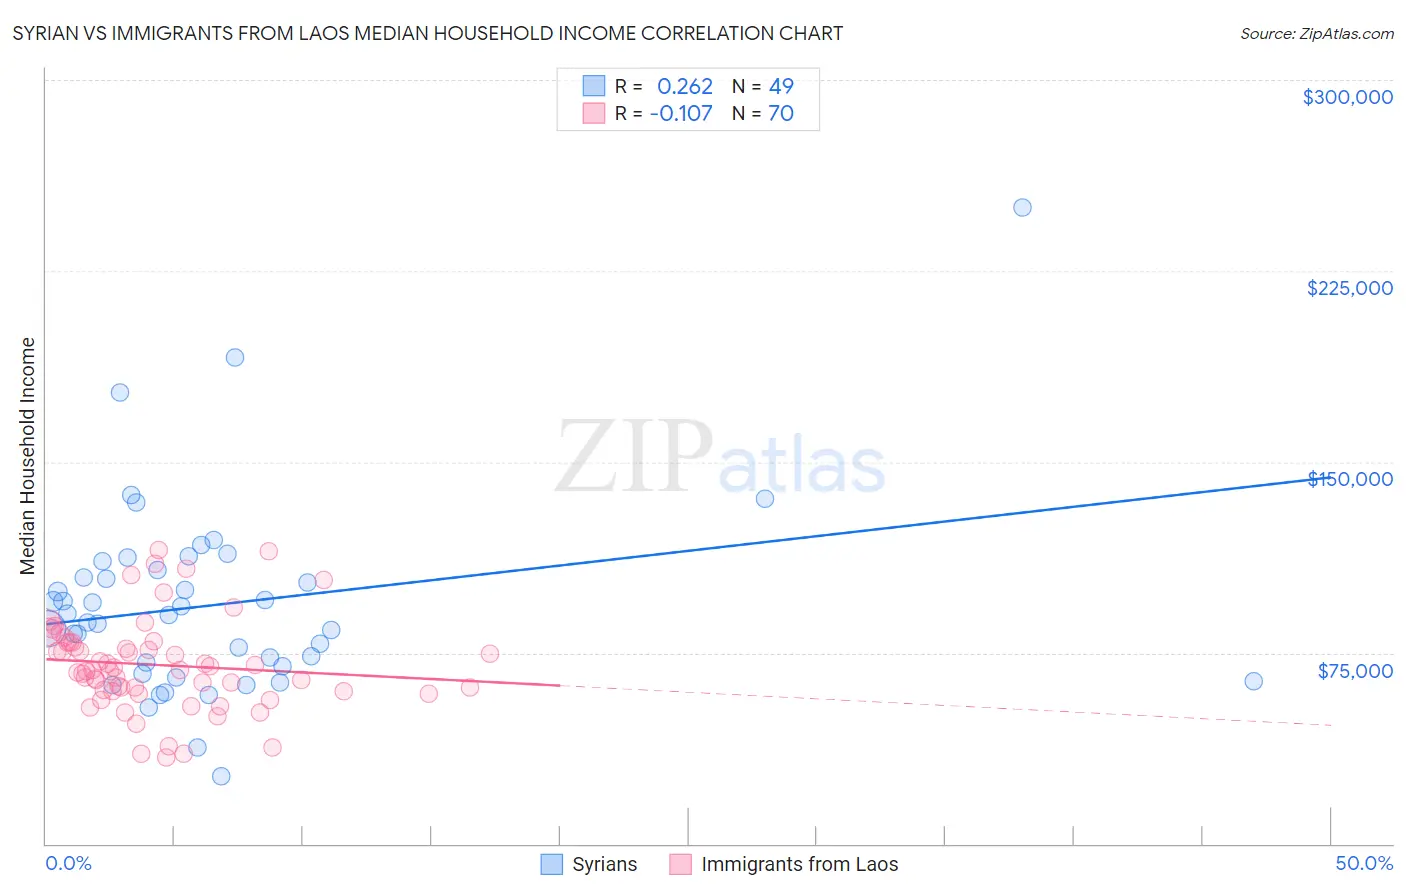
Syrian vs Immigrants from Laos Median Household Income Correlation Chart
The statistical analysis conducted on geographies consisting of 266,119,923 people shows a weak positive correlation between the proportion of Syrians and median household income in the United States with a correlation coefficient (R) of 0.262 and weighted average of $89,830. Similarly, the statistical analysis conducted on geographies consisting of 201,460,424 people shows a poor negative correlation between the proportion of Immigrants from Laos and median household income in the United States with a correlation coefficient (R) of -0.107 and weighted average of $78,327, a difference of 14.7%.
Median Household Income Correlation Summary
| Measurement | Syrian | Immigrants from Laos |
| Minimum | $26,364 | $33,804 |
| Maximum | $250,001 | $115,579 |
| Range | $223,637 | $81,775 |
| Mean | $94,106 | $70,206 |
| Median | $89,903 | $68,245 |
| Interquartile 25% (IQ1) | $68,162 | $59,790 |
| Interquartile 75% (IQ3) | $109,343 | $78,877 |
| Interquartile Range (IQR) | $41,181 | $19,087 |
| Standard Deviation (Sample) | $38,336 | $18,088 |
| Standard Deviation (Population) | $37,943 | $17,959 |
Similar Demographics by Median Household Income
Demographics Similar to Syrians by Median Household Income
In terms of median household income, the demographic groups most similar to Syrians are Taiwanese ($89,900, a difference of 0.080%), Native Hawaiian ($89,919, a difference of 0.10%), Albanian ($89,744, a difference of 0.10%), Immigrants from North Macedonia ($89,741, a difference of 0.10%), and Immigrants from Western Asia ($90,005, a difference of 0.19%).
| Demographics | Rating | Rank | Median Household Income |
| Immigrants | Poland | 97.1 /100 | #111 | Exceptional $90,549 |
| Northern Europeans | 96.9 /100 | #112 | Exceptional $90,446 |
| Peruvians | 96.5 /100 | #113 | Exceptional $90,261 |
| Immigrants | Northern Africa | 95.9 /100 | #114 | Exceptional $90,026 |
| Immigrants | Western Asia | 95.9 /100 | #115 | Exceptional $90,005 |
| Native Hawaiians | 95.7 /100 | #116 | Exceptional $89,919 |
| Taiwanese | 95.6 /100 | #117 | Exceptional $89,900 |
| Syrians | 95.4 /100 | #118 | Exceptional $89,830 |
| Albanians | 95.2 /100 | #119 | Exceptional $89,744 |
| Immigrants | North Macedonia | 95.2 /100 | #120 | Exceptional $89,741 |
| Ethiopians | 94.9 /100 | #121 | Exceptional $89,640 |
| Pakistanis | 94.8 /100 | #122 | Exceptional $89,638 |
| Immigrants | Zimbabwe | 94.4 /100 | #123 | Exceptional $89,496 |
| Immigrants | Jordan | 94.1 /100 | #124 | Exceptional $89,412 |
| Immigrants | Kuwait | 93.5 /100 | #125 | Exceptional $89,263 |
Demographics Similar to Immigrants from Laos by Median Household Income
In terms of median household income, the demographic groups most similar to Immigrants from Laos are West Indian ($78,455, a difference of 0.16%), Mexican American Indian ($78,166, a difference of 0.21%), Sudanese ($78,529, a difference of 0.26%), Immigrants from Burma/Myanmar ($78,682, a difference of 0.45%), and Immigrants from West Indies ($77,956, a difference of 0.48%).
| Demographics | Rating | Rank | Median Household Income |
| Immigrants | Barbados | 1.9 /100 | #243 | Tragic $78,989 |
| Marshallese | 1.9 /100 | #244 | Tragic $78,930 |
| Inupiat | 1.8 /100 | #245 | Tragic $78,841 |
| Central Americans | 1.7 /100 | #246 | Tragic $78,803 |
| Immigrants | Burma/Myanmar | 1.6 /100 | #247 | Tragic $78,682 |
| Sudanese | 1.5 /100 | #248 | Tragic $78,529 |
| West Indians | 1.4 /100 | #249 | Tragic $78,455 |
| Immigrants | Laos | 1.3 /100 | #250 | Tragic $78,327 |
| Mexican American Indians | 1.2 /100 | #251 | Tragic $78,166 |
| Immigrants | West Indies | 1.0 /100 | #252 | Tragic $77,956 |
| Immigrants | St. Vincent and the Grenadines | 0.9 /100 | #253 | Tragic $77,690 |
| Sub-Saharan Africans | 0.8 /100 | #254 | Tragic $77,631 |
| Immigrants | Middle Africa | 0.8 /100 | #255 | Tragic $77,559 |
| Belizeans | 0.6 /100 | #256 | Tragic $77,028 |
| Immigrants | Senegal | 0.5 /100 | #257 | Tragic $76,915 |