Swedish vs Immigrants from Northern Europe Married-Couple Family Poverty
COMPARE
Swedish
Immigrants from Northern Europe
Married-Couple Family Poverty
Married-Couple Family Poverty Comparison
Swedes
Immigrants from Northern Europe
3.9%
MARRIED-COUPLE FAMILY POVERTY
100.0/ 100
METRIC RATING
5th/ 347
METRIC RANK
4.2%
MARRIED-COUPLE FAMILY POVERTY
99.8/ 100
METRIC RATING
39th/ 347
METRIC RANK
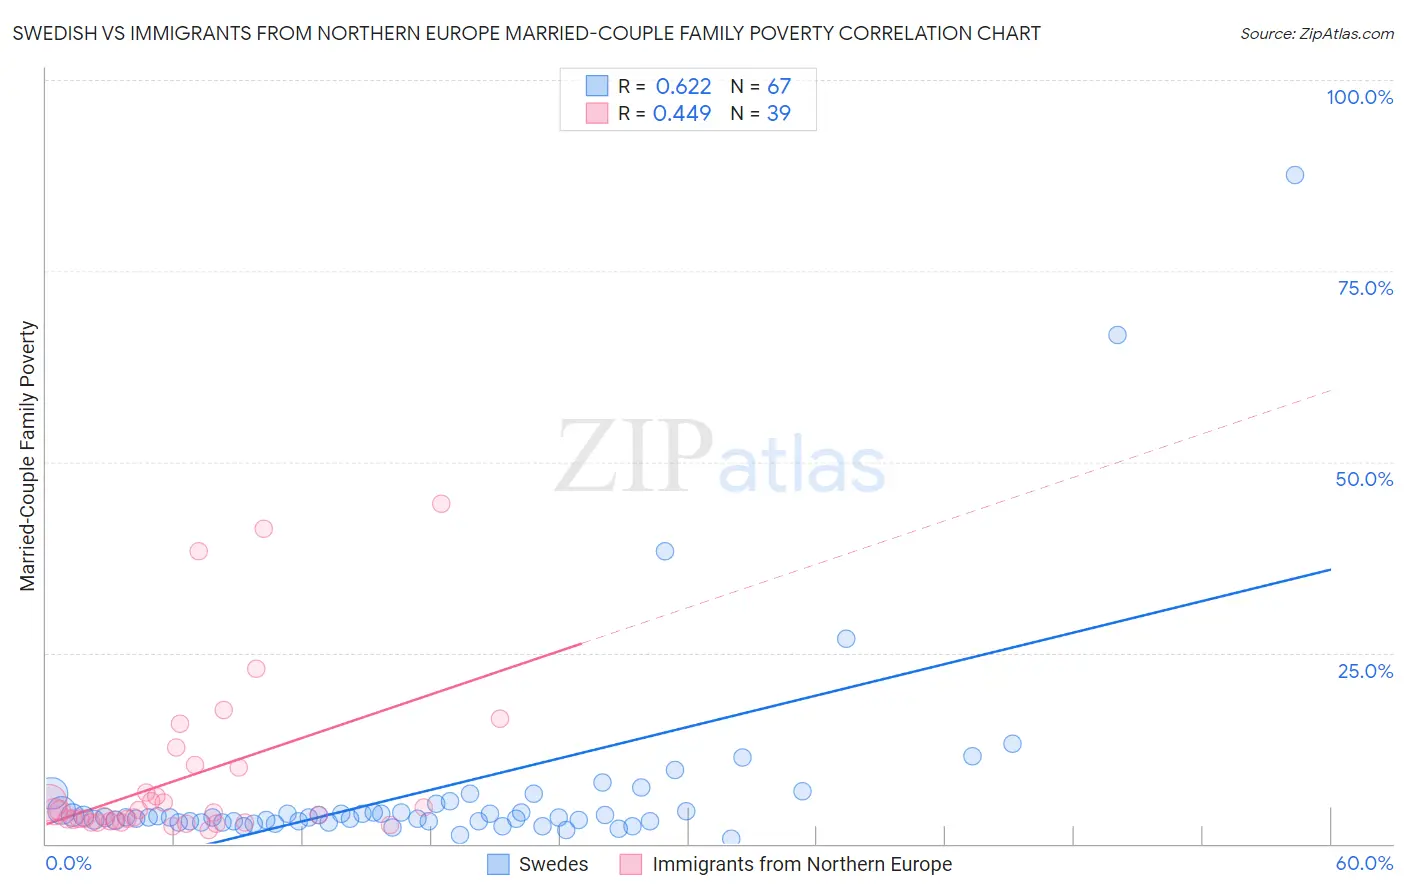
Swedish vs Immigrants from Northern Europe Married-Couple Family Poverty Correlation Chart
The statistical analysis conducted on geographies consisting of 527,096,192 people shows a significant positive correlation between the proportion of Swedes and poverty level among married-couple families in the United States with a correlation coefficient (R) of 0.622 and weighted average of 3.9%. Similarly, the statistical analysis conducted on geographies consisting of 470,220,521 people shows a moderate positive correlation between the proportion of Immigrants from Northern Europe and poverty level among married-couple families in the United States with a correlation coefficient (R) of 0.449 and weighted average of 4.2%, a difference of 9.9%.
Married-Couple Family Poverty Correlation Summary
| Measurement | Swedish | Immigrants from Northern Europe |
| Minimum | 0.65% | 1.9% |
| Maximum | 87.5% | 44.4% |
| Range | 86.9% | 42.6% |
| Mean | 7.1% | 8.6% |
| Median | 3.4% | 4.2% |
| Interquartile 25% (IQ1) | 2.9% | 3.0% |
| Interquartile 75% (IQ3) | 4.3% | 10.0% |
| Interquartile Range (IQR) | 1.4% | 7.0% |
| Standard Deviation (Sample) | 13.7% | 10.7% |
| Standard Deviation (Population) | 13.5% | 10.6% |
Similar Demographics by Married-Couple Family Poverty
Demographics Similar to Swedes by Married-Couple Family Poverty
In terms of married-couple family poverty, the demographic groups most similar to Swedes are Slovene (3.8%, a difference of 0.15%), Luxembourger (3.9%, a difference of 0.61%), Latvian (3.9%, a difference of 1.1%), Thai (3.9%, a difference of 1.7%), and Croatian (3.9%, a difference of 2.1%).
| Demographics | Rating | Rank | Married-Couple Family Poverty |
| Immigrants | India | 100.0 /100 | #1 | Exceptional 3.6% |
| Chinese | 100.0 /100 | #2 | Exceptional 3.6% |
| Norwegians | 100.0 /100 | #3 | Exceptional 3.7% |
| Slovenes | 100.0 /100 | #4 | Exceptional 3.8% |
| Swedes | 100.0 /100 | #5 | Exceptional 3.9% |
| Luxembourgers | 100.0 /100 | #6 | Exceptional 3.9% |
| Latvians | 100.0 /100 | #7 | Exceptional 3.9% |
| Thais | 100.0 /100 | #8 | Exceptional 3.9% |
| Croatians | 100.0 /100 | #9 | Exceptional 3.9% |
| Carpatho Rusyns | 100.0 /100 | #10 | Exceptional 3.9% |
| Lithuanians | 100.0 /100 | #11 | Exceptional 4.0% |
| Bulgarians | 100.0 /100 | #12 | Exceptional 4.0% |
| Czechs | 100.0 /100 | #13 | Exceptional 4.0% |
| Slovaks | 100.0 /100 | #14 | Exceptional 4.0% |
| Poles | 100.0 /100 | #15 | Exceptional 4.0% |
Demographics Similar to Immigrants from Northern Europe by Married-Couple Family Poverty
In terms of married-couple family poverty, the demographic groups most similar to Immigrants from Northern Europe are Belgian (4.2%, a difference of 0.13%), Iranian (4.2%, a difference of 0.25%), French Canadian (4.2%, a difference of 0.28%), English (4.2%, a difference of 0.32%), and European (4.2%, a difference of 0.35%).
| Demographics | Rating | Rank | Married-Couple Family Poverty |
| Greeks | 99.9 /100 | #32 | Exceptional 4.2% |
| Irish | 99.9 /100 | #33 | Exceptional 4.2% |
| Dutch | 99.9 /100 | #34 | Exceptional 4.2% |
| Europeans | 99.9 /100 | #35 | Exceptional 4.2% |
| English | 99.9 /100 | #36 | Exceptional 4.2% |
| Iranians | 99.9 /100 | #37 | Exceptional 4.2% |
| Belgians | 99.9 /100 | #38 | Exceptional 4.2% |
| Immigrants | Northern Europe | 99.8 /100 | #39 | Exceptional 4.2% |
| French Canadians | 99.8 /100 | #40 | Exceptional 4.2% |
| Northern Europeans | 99.8 /100 | #41 | Exceptional 4.3% |
| Scottish | 99.8 /100 | #42 | Exceptional 4.3% |
| Swiss | 99.8 /100 | #43 | Exceptional 4.3% |
| Immigrants | Japan | 99.8 /100 | #44 | Exceptional 4.3% |
| Serbians | 99.8 /100 | #45 | Exceptional 4.3% |
| British | 99.8 /100 | #46 | Exceptional 4.3% |