Spaniard vs Inupiat Single Female Poverty
COMPARE
Spaniard
Inupiat
Single Female Poverty
Single Female Poverty Comparison
Spaniards
Inupiat
22.0%
SINGLE FEMALE POVERTY
4.7/ 100
METRIC RATING
233rd/ 347
METRIC RANK
23.1%
SINGLE FEMALE POVERTY
0.2/ 100
METRIC RATING
270th/ 347
METRIC RANK
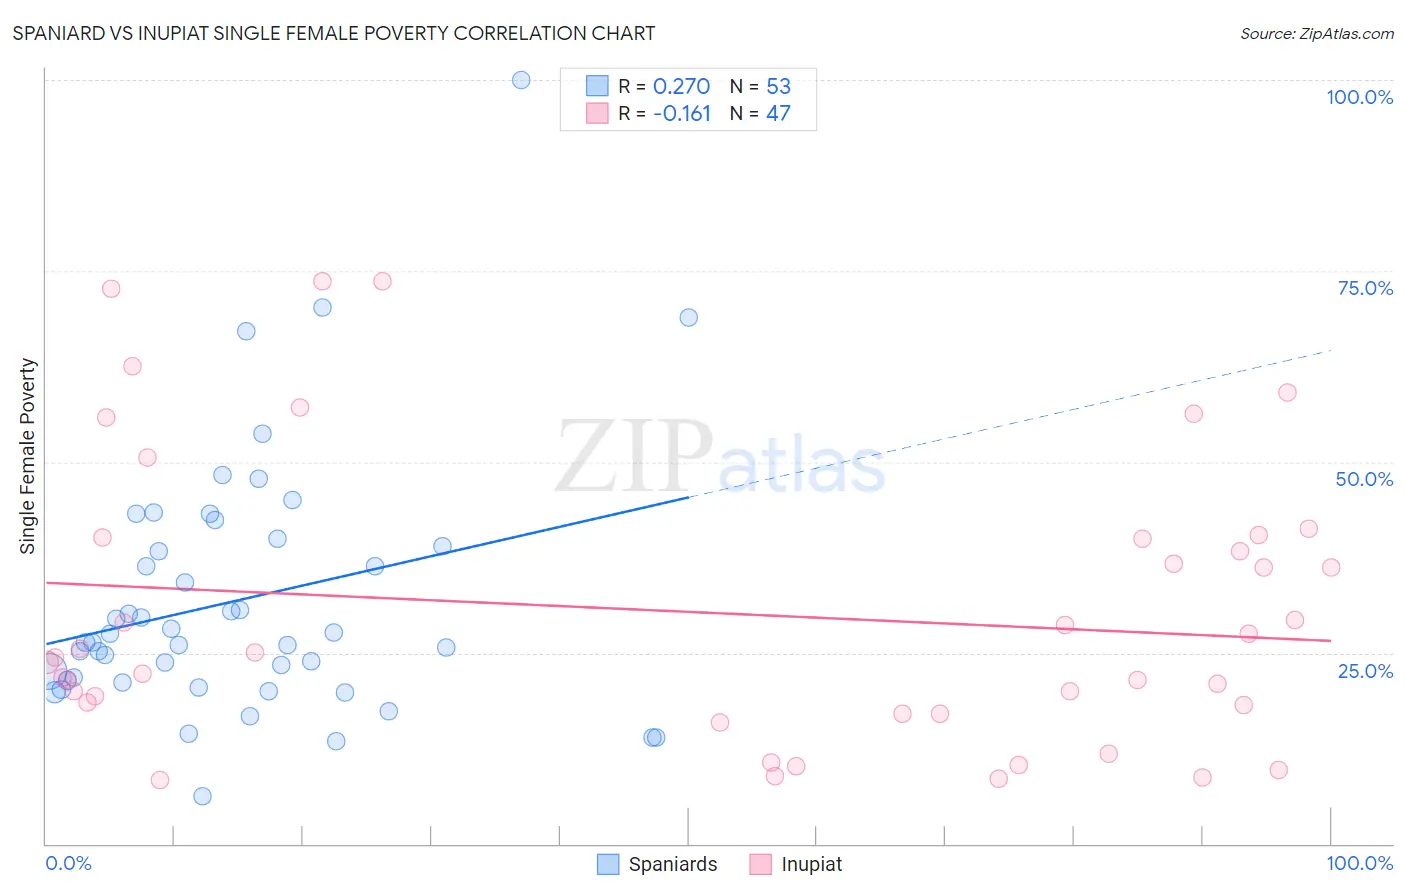
Spaniard vs Inupiat Single Female Poverty Correlation Chart
The statistical analysis conducted on geographies consisting of 435,429,561 people shows a weak positive correlation between the proportion of Spaniards and poverty level among single females in the United States with a correlation coefficient (R) of 0.270 and weighted average of 22.0%. Similarly, the statistical analysis conducted on geographies consisting of 95,986,972 people shows a poor negative correlation between the proportion of Inupiat and poverty level among single females in the United States with a correlation coefficient (R) of -0.161 and weighted average of 23.1%, a difference of 5.2%.
Single Female Poverty Correlation Summary
| Measurement | Spaniard | Inupiat |
| Minimum | 6.3% | 8.3% |
| Maximum | 100.0% | 73.6% |
| Range | 93.7% | 65.3% |
| Mean | 31.9% | 30.3% |
| Median | 26.3% | 24.4% |
| Interquartile 25% (IQ1) | 21.2% | 17.1% |
| Interquartile 75% (IQ3) | 39.4% | 40.1% |
| Interquartile Range (IQR) | 18.2% | 23.1% |
| Standard Deviation (Sample) | 16.8% | 18.6% |
| Standard Deviation (Population) | 16.6% | 18.4% |
Similar Demographics by Single Female Poverty
Demographics Similar to Spaniards by Single Female Poverty
In terms of single female poverty, the demographic groups most similar to Spaniards are Spanish (22.0%, a difference of 0.0%), Dutch (22.0%, a difference of 0.020%), Immigrants from Thailand (22.0%, a difference of 0.090%), Welsh (22.0%, a difference of 0.11%), and Immigrants from Ecuador (22.0%, a difference of 0.18%).
| Demographics | Rating | Rank | Single Female Poverty |
| Immigrants | Portugal | 5.8 /100 | #226 | Tragic 21.9% |
| Immigrants | Ghana | 5.8 /100 | #227 | Tragic 21.9% |
| Salvadorans | 5.5 /100 | #228 | Tragic 21.9% |
| Tlingit-Haida | 5.4 /100 | #229 | Tragic 21.9% |
| Immigrants | Western Africa | 5.3 /100 | #230 | Tragic 22.0% |
| Welsh | 5.0 /100 | #231 | Tragic 22.0% |
| Immigrants | Thailand | 5.0 /100 | #232 | Tragic 22.0% |
| Spaniards | 4.7 /100 | #233 | Tragic 22.0% |
| Spanish | 4.7 /100 | #234 | Tragic 22.0% |
| Dutch | 4.6 /100 | #235 | Tragic 22.0% |
| Immigrants | Ecuador | 4.2 /100 | #236 | Tragic 22.0% |
| Vietnamese | 4.0 /100 | #237 | Tragic 22.0% |
| French Canadians | 2.8 /100 | #238 | Tragic 22.2% |
| Malaysians | 2.8 /100 | #239 | Tragic 22.2% |
| French | 2.3 /100 | #240 | Tragic 22.2% |
Demographics Similar to Inupiat by Single Female Poverty
In terms of single female poverty, the demographic groups most similar to Inupiat are Subsaharan African (23.2%, a difference of 0.25%), Hmong (23.1%, a difference of 0.26%), Fijian (23.1%, a difference of 0.28%), Senegalese (23.0%, a difference of 0.35%), and Immigrants from Micronesia (23.0%, a difference of 0.41%).
| Demographics | Rating | Rank | Single Female Poverty |
| Scotch-Irish | 0.3 /100 | #263 | Tragic 22.9% |
| Immigrants | Laos | 0.3 /100 | #264 | Tragic 22.9% |
| Central Americans | 0.2 /100 | #265 | Tragic 23.0% |
| Immigrants | Micronesia | 0.2 /100 | #266 | Tragic 23.0% |
| Senegalese | 0.2 /100 | #267 | Tragic 23.0% |
| Fijians | 0.2 /100 | #268 | Tragic 23.1% |
| Hmong | 0.2 /100 | #269 | Tragic 23.1% |
| Inupiat | 0.2 /100 | #270 | Tragic 23.1% |
| Sub-Saharan Africans | 0.1 /100 | #271 | Tragic 23.2% |
| Immigrants | Senegal | 0.1 /100 | #272 | Tragic 23.2% |
| Alaska Natives | 0.1 /100 | #273 | Tragic 23.3% |
| Marshallese | 0.1 /100 | #274 | Tragic 23.3% |
| Mexican American Indians | 0.1 /100 | #275 | Tragic 23.4% |
| Immigrants | Azores | 0.0 /100 | #276 | Tragic 23.5% |
| Pennsylvania Germans | 0.0 /100 | #277 | Tragic 23.6% |