Spaniard vs Immigrants from Sierra Leone Single Female Poverty
COMPARE
Spaniard
Immigrants from Sierra Leone
Single Female Poverty
Single Female Poverty Comparison
Spaniards
Immigrants from Sierra Leone
22.0%
SINGLE FEMALE POVERTY
4.7/ 100
METRIC RATING
233rd/ 347
METRIC RANK
19.4%
SINGLE FEMALE POVERTY
99.3/ 100
METRIC RATING
79th/ 347
METRIC RANK
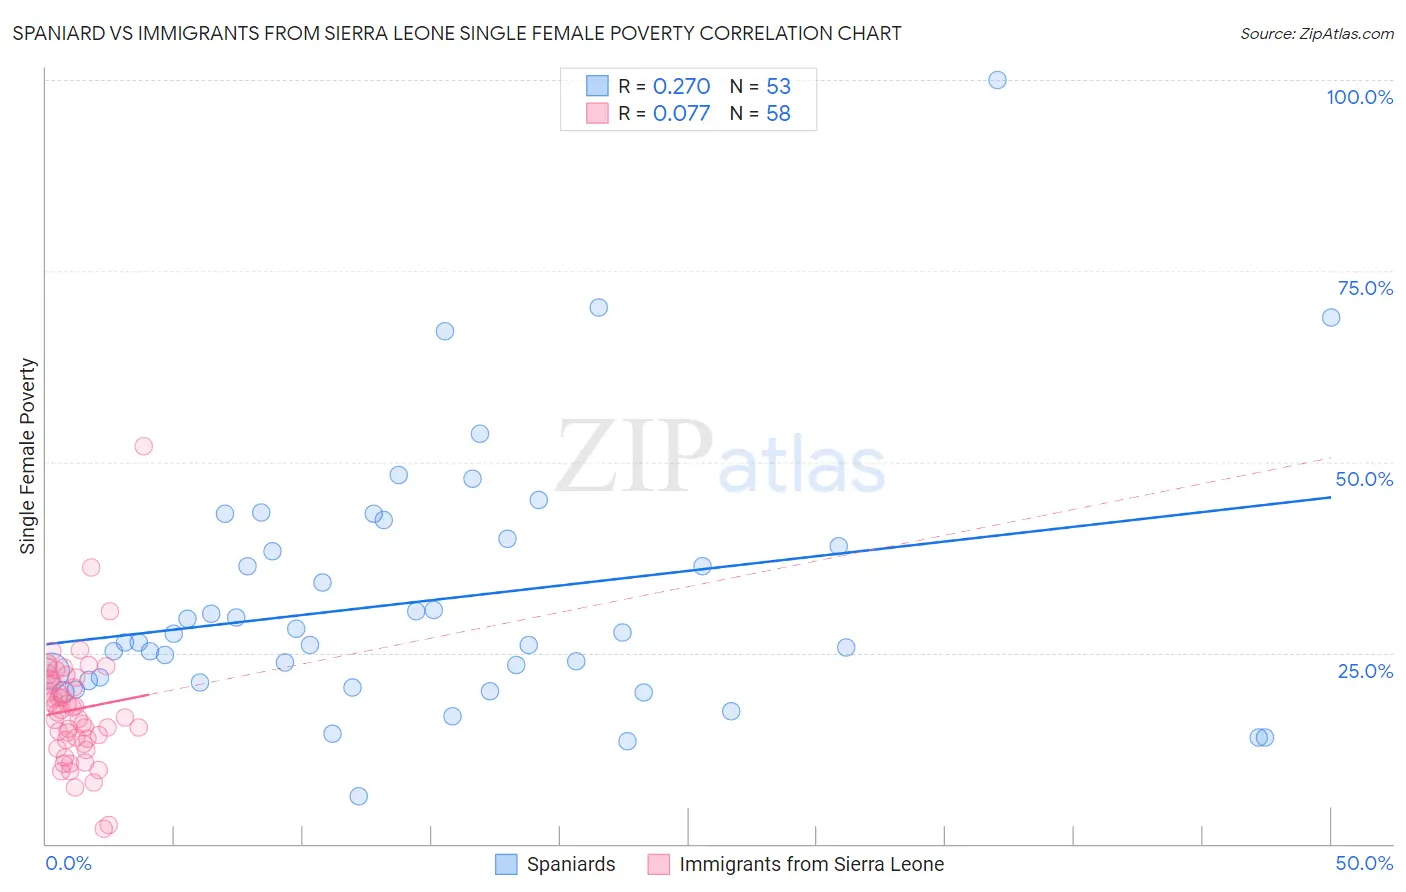
Spaniard vs Immigrants from Sierra Leone Single Female Poverty Correlation Chart
The statistical analysis conducted on geographies consisting of 435,429,561 people shows a weak positive correlation between the proportion of Spaniards and poverty level among single females in the United States with a correlation coefficient (R) of 0.270 and weighted average of 22.0%. Similarly, the statistical analysis conducted on geographies consisting of 101,303,700 people shows a slight positive correlation between the proportion of Immigrants from Sierra Leone and poverty level among single females in the United States with a correlation coefficient (R) of 0.077 and weighted average of 19.4%, a difference of 13.4%.
Single Female Poverty Correlation Summary
| Measurement | Spaniard | Immigrants from Sierra Leone |
| Minimum | 6.3% | 1.9% |
| Maximum | 100.0% | 52.1% |
| Range | 93.7% | 50.2% |
| Mean | 31.9% | 17.6% |
| Median | 26.3% | 17.4% |
| Interquartile 25% (IQ1) | 21.2% | 13.6% |
| Interquartile 75% (IQ3) | 39.4% | 21.7% |
| Interquartile Range (IQR) | 18.2% | 8.1% |
| Standard Deviation (Sample) | 16.8% | 7.7% |
| Standard Deviation (Population) | 16.6% | 7.6% |
Similar Demographics by Single Female Poverty
Demographics Similar to Spaniards by Single Female Poverty
In terms of single female poverty, the demographic groups most similar to Spaniards are Spanish (22.0%, a difference of 0.0%), Dutch (22.0%, a difference of 0.020%), Immigrants from Thailand (22.0%, a difference of 0.090%), Welsh (22.0%, a difference of 0.11%), and Immigrants from Ecuador (22.0%, a difference of 0.18%).
| Demographics | Rating | Rank | Single Female Poverty |
| Immigrants | Portugal | 5.8 /100 | #226 | Tragic 21.9% |
| Immigrants | Ghana | 5.8 /100 | #227 | Tragic 21.9% |
| Salvadorans | 5.5 /100 | #228 | Tragic 21.9% |
| Tlingit-Haida | 5.4 /100 | #229 | Tragic 21.9% |
| Immigrants | Western Africa | 5.3 /100 | #230 | Tragic 22.0% |
| Welsh | 5.0 /100 | #231 | Tragic 22.0% |
| Immigrants | Thailand | 5.0 /100 | #232 | Tragic 22.0% |
| Spaniards | 4.7 /100 | #233 | Tragic 22.0% |
| Spanish | 4.7 /100 | #234 | Tragic 22.0% |
| Dutch | 4.6 /100 | #235 | Tragic 22.0% |
| Immigrants | Ecuador | 4.2 /100 | #236 | Tragic 22.0% |
| Vietnamese | 4.0 /100 | #237 | Tragic 22.0% |
| French Canadians | 2.8 /100 | #238 | Tragic 22.2% |
| Malaysians | 2.8 /100 | #239 | Tragic 22.2% |
| French | 2.3 /100 | #240 | Tragic 22.2% |
Demographics Similar to Immigrants from Sierra Leone by Single Female Poverty
In terms of single female poverty, the demographic groups most similar to Immigrants from Sierra Leone are Albanian (19.4%, a difference of 0.020%), Immigrants from Australia (19.4%, a difference of 0.040%), Immigrants from Scotland (19.4%, a difference of 0.060%), Immigrants from Malaysia (19.4%, a difference of 0.070%), and Taiwanese (19.4%, a difference of 0.080%).
| Demographics | Rating | Rank | Single Female Poverty |
| Immigrants | Latvia | 99.4 /100 | #72 | Exceptional 19.3% |
| Immigrants | Peru | 99.4 /100 | #73 | Exceptional 19.3% |
| Immigrants | Belarus | 99.4 /100 | #74 | Exceptional 19.3% |
| Immigrants | Turkey | 99.4 /100 | #75 | Exceptional 19.4% |
| Peruvians | 99.4 /100 | #76 | Exceptional 19.4% |
| Immigrants | Russia | 99.3 /100 | #77 | Exceptional 19.4% |
| Albanians | 99.3 /100 | #78 | Exceptional 19.4% |
| Immigrants | Sierra Leone | 99.3 /100 | #79 | Exceptional 19.4% |
| Immigrants | Australia | 99.3 /100 | #80 | Exceptional 19.4% |
| Immigrants | Scotland | 99.2 /100 | #81 | Exceptional 19.4% |
| Immigrants | Malaysia | 99.2 /100 | #82 | Exceptional 19.4% |
| Taiwanese | 99.2 /100 | #83 | Exceptional 19.4% |
| Immigrants | Sweden | 99.2 /100 | #84 | Exceptional 19.4% |
| Immigrants | Albania | 99.2 /100 | #85 | Exceptional 19.4% |
| Greeks | 99.2 /100 | #86 | Exceptional 19.4% |