Spaniard vs Immigrants from Hungary Single Female Poverty
COMPARE
Spaniard
Immigrants from Hungary
Single Female Poverty
Single Female Poverty Comparison
Spaniards
Immigrants from Hungary
22.0%
SINGLE FEMALE POVERTY
4.7/ 100
METRIC RATING
233rd/ 347
METRIC RANK
20.2%
SINGLE FEMALE POVERTY
92.3/ 100
METRIC RATING
130th/ 347
METRIC RANK
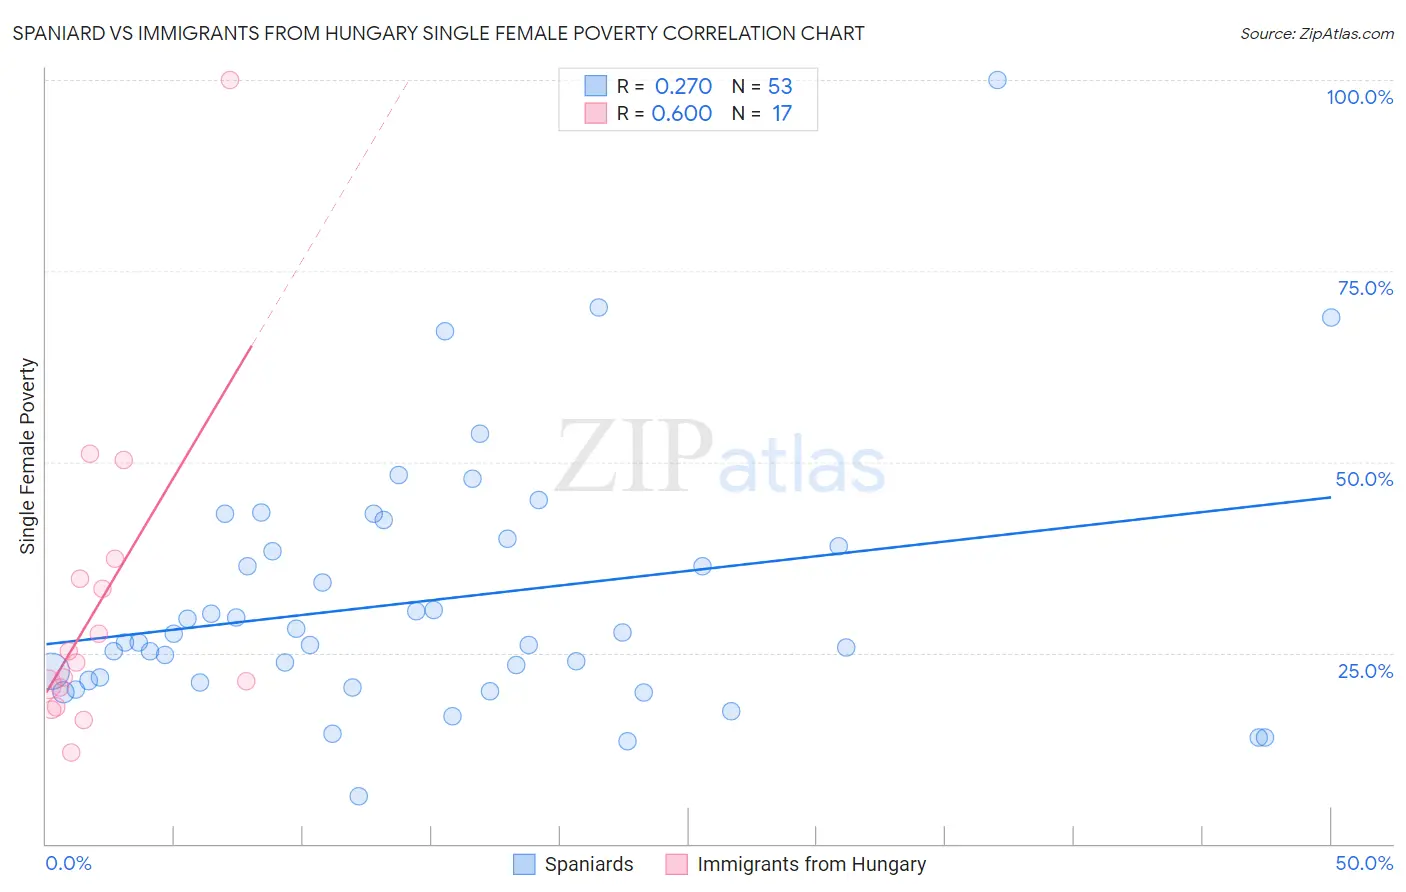
Spaniard vs Immigrants from Hungary Single Female Poverty Correlation Chart
The statistical analysis conducted on geographies consisting of 435,429,561 people shows a weak positive correlation between the proportion of Spaniards and poverty level among single females in the United States with a correlation coefficient (R) of 0.270 and weighted average of 22.0%. Similarly, the statistical analysis conducted on geographies consisting of 193,674,304 people shows a substantial positive correlation between the proportion of Immigrants from Hungary and poverty level among single females in the United States with a correlation coefficient (R) of 0.600 and weighted average of 20.2%, a difference of 8.9%.
Single Female Poverty Correlation Summary
| Measurement | Spaniard | Immigrants from Hungary |
| Minimum | 6.3% | 11.9% |
| Maximum | 100.0% | 100.0% |
| Range | 93.7% | 88.1% |
| Mean | 31.9% | 31.2% |
| Median | 26.3% | 23.7% |
| Interquartile 25% (IQ1) | 21.2% | 19.2% |
| Interquartile 75% (IQ3) | 39.4% | 36.0% |
| Interquartile Range (IQR) | 18.2% | 16.9% |
| Standard Deviation (Sample) | 16.8% | 20.9% |
| Standard Deviation (Population) | 16.6% | 20.3% |
Similar Demographics by Single Female Poverty
Demographics Similar to Spaniards by Single Female Poverty
In terms of single female poverty, the demographic groups most similar to Spaniards are Spanish (22.0%, a difference of 0.0%), Dutch (22.0%, a difference of 0.020%), Immigrants from Thailand (22.0%, a difference of 0.090%), Welsh (22.0%, a difference of 0.11%), and Immigrants from Ecuador (22.0%, a difference of 0.18%).
| Demographics | Rating | Rank | Single Female Poverty |
| Immigrants | Portugal | 5.8 /100 | #226 | Tragic 21.9% |
| Immigrants | Ghana | 5.8 /100 | #227 | Tragic 21.9% |
| Salvadorans | 5.5 /100 | #228 | Tragic 21.9% |
| Tlingit-Haida | 5.4 /100 | #229 | Tragic 21.9% |
| Immigrants | Western Africa | 5.3 /100 | #230 | Tragic 22.0% |
| Welsh | 5.0 /100 | #231 | Tragic 22.0% |
| Immigrants | Thailand | 5.0 /100 | #232 | Tragic 22.0% |
| Spaniards | 4.7 /100 | #233 | Tragic 22.0% |
| Spanish | 4.7 /100 | #234 | Tragic 22.0% |
| Dutch | 4.6 /100 | #235 | Tragic 22.0% |
| Immigrants | Ecuador | 4.2 /100 | #236 | Tragic 22.0% |
| Vietnamese | 4.0 /100 | #237 | Tragic 22.0% |
| French Canadians | 2.8 /100 | #238 | Tragic 22.2% |
| Malaysians | 2.8 /100 | #239 | Tragic 22.2% |
| French | 2.3 /100 | #240 | Tragic 22.2% |
Demographics Similar to Immigrants from Hungary by Single Female Poverty
In terms of single female poverty, the demographic groups most similar to Immigrants from Hungary are Immigrants from Morocco (20.2%, a difference of 0.030%), Pakistani (20.2%, a difference of 0.050%), Uruguayan (20.2%, a difference of 0.050%), Immigrants from England (20.2%, a difference of 0.090%), and Immigrants from Spain (20.2%, a difference of 0.10%).
| Demographics | Rating | Rank | Single Female Poverty |
| Brazilians | 94.4 /100 | #123 | Exceptional 20.1% |
| Immigrants | Chile | 94.3 /100 | #124 | Exceptional 20.1% |
| Immigrants | South Africa | 93.9 /100 | #125 | Exceptional 20.1% |
| Serbians | 93.3 /100 | #126 | Exceptional 20.1% |
| Mongolians | 93.2 /100 | #127 | Exceptional 20.2% |
| Immigrants | Spain | 92.7 /100 | #128 | Exceptional 20.2% |
| Immigrants | Morocco | 92.4 /100 | #129 | Exceptional 20.2% |
| Immigrants | Hungary | 92.3 /100 | #130 | Exceptional 20.2% |
| Pakistanis | 92.1 /100 | #131 | Exceptional 20.2% |
| Uruguayans | 92.1 /100 | #132 | Exceptional 20.2% |
| Immigrants | England | 91.9 /100 | #133 | Exceptional 20.2% |
| Immigrants | Venezuela | 91.5 /100 | #134 | Exceptional 20.2% |
| Immigrants | Iraq | 91.2 /100 | #135 | Exceptional 20.2% |
| Immigrants | Canada | 91.2 /100 | #136 | Exceptional 20.2% |
| Immigrants | Nepal | 90.6 /100 | #137 | Exceptional 20.3% |