Spaniard vs Croatian Single Female Poverty
COMPARE
Spaniard
Croatian
Single Female Poverty
Single Female Poverty Comparison
Spaniards
Croatians
22.0%
SINGLE FEMALE POVERTY
4.7/ 100
METRIC RATING
233rd/ 347
METRIC RANK
19.7%
SINGLE FEMALE POVERTY
98.1/ 100
METRIC RATING
97th/ 347
METRIC RANK
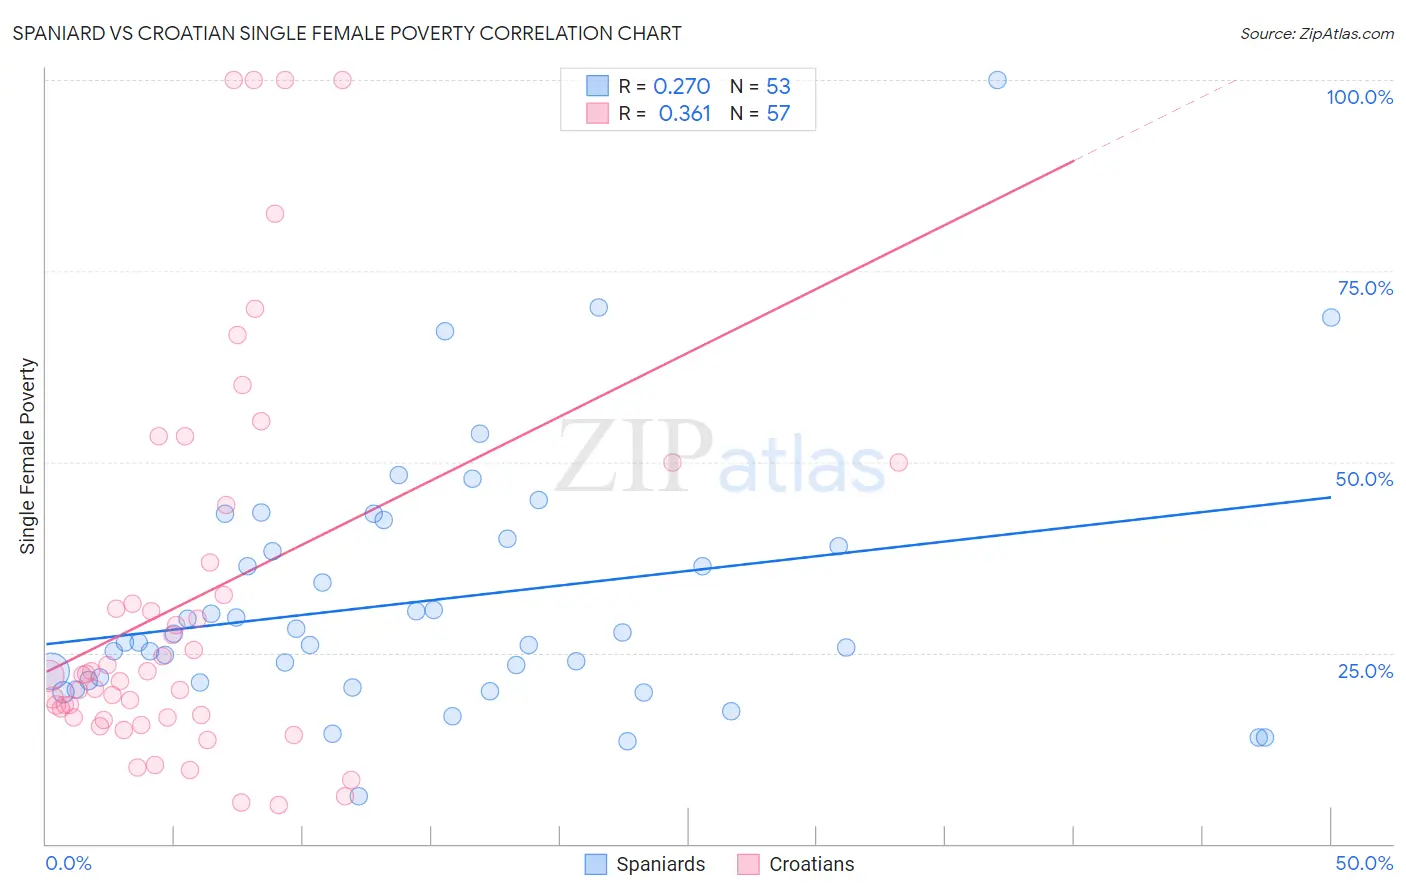
Spaniard vs Croatian Single Female Poverty Correlation Chart
The statistical analysis conducted on geographies consisting of 435,429,561 people shows a weak positive correlation between the proportion of Spaniards and poverty level among single females in the United States with a correlation coefficient (R) of 0.270 and weighted average of 22.0%. Similarly, the statistical analysis conducted on geographies consisting of 368,567,193 people shows a mild positive correlation between the proportion of Croatians and poverty level among single females in the United States with a correlation coefficient (R) of 0.361 and weighted average of 19.7%, a difference of 11.5%.
Single Female Poverty Correlation Summary
| Measurement | Spaniard | Croatian |
| Minimum | 6.3% | 5.0% |
| Maximum | 100.0% | 100.0% |
| Range | 93.7% | 95.0% |
| Mean | 31.9% | 32.0% |
| Median | 26.3% | 22.1% |
| Interquartile 25% (IQ1) | 21.2% | 16.5% |
| Interquartile 75% (IQ3) | 39.4% | 40.6% |
| Interquartile Range (IQR) | 18.2% | 24.0% |
| Standard Deviation (Sample) | 16.8% | 25.3% |
| Standard Deviation (Population) | 16.6% | 25.1% |
Similar Demographics by Single Female Poverty
Demographics Similar to Spaniards by Single Female Poverty
In terms of single female poverty, the demographic groups most similar to Spaniards are Spanish (22.0%, a difference of 0.0%), Dutch (22.0%, a difference of 0.020%), Immigrants from Thailand (22.0%, a difference of 0.090%), Welsh (22.0%, a difference of 0.11%), and Immigrants from Ecuador (22.0%, a difference of 0.18%).
| Demographics | Rating | Rank | Single Female Poverty |
| Immigrants | Portugal | 5.8 /100 | #226 | Tragic 21.9% |
| Immigrants | Ghana | 5.8 /100 | #227 | Tragic 21.9% |
| Salvadorans | 5.5 /100 | #228 | Tragic 21.9% |
| Tlingit-Haida | 5.4 /100 | #229 | Tragic 21.9% |
| Immigrants | Western Africa | 5.3 /100 | #230 | Tragic 22.0% |
| Welsh | 5.0 /100 | #231 | Tragic 22.0% |
| Immigrants | Thailand | 5.0 /100 | #232 | Tragic 22.0% |
| Spaniards | 4.7 /100 | #233 | Tragic 22.0% |
| Spanish | 4.7 /100 | #234 | Tragic 22.0% |
| Dutch | 4.6 /100 | #235 | Tragic 22.0% |
| Immigrants | Ecuador | 4.2 /100 | #236 | Tragic 22.0% |
| Vietnamese | 4.0 /100 | #237 | Tragic 22.0% |
| French Canadians | 2.8 /100 | #238 | Tragic 22.2% |
| Malaysians | 2.8 /100 | #239 | Tragic 22.2% |
| French | 2.3 /100 | #240 | Tragic 22.2% |
Demographics Similar to Croatians by Single Female Poverty
In terms of single female poverty, the demographic groups most similar to Croatians are Immigrants from Brazil (19.7%, a difference of 0.090%), Immigrants from France (19.7%, a difference of 0.13%), Estonian (19.7%, a difference of 0.14%), Sierra Leonean (19.7%, a difference of 0.14%), and Ukrainian (19.8%, a difference of 0.39%).
| Demographics | Rating | Rank | Single Female Poverty |
| Immigrants | Lebanon | 98.8 /100 | #90 | Exceptional 19.6% |
| Soviet Union | 98.8 /100 | #91 | Exceptional 19.6% |
| Italians | 98.8 /100 | #92 | Exceptional 19.6% |
| Immigrants | Austria | 98.8 /100 | #93 | Exceptional 19.6% |
| Romanians | 98.6 /100 | #94 | Exceptional 19.6% |
| Estonians | 98.2 /100 | #95 | Exceptional 19.7% |
| Immigrants | Brazil | 98.2 /100 | #96 | Exceptional 19.7% |
| Croatians | 98.1 /100 | #97 | Exceptional 19.7% |
| Immigrants | France | 97.9 /100 | #98 | Exceptional 19.7% |
| Sierra Leoneans | 97.9 /100 | #99 | Exceptional 19.7% |
| Ukrainians | 97.6 /100 | #100 | Exceptional 19.8% |
| Immigrants | Belgium | 97.3 /100 | #101 | Exceptional 19.8% |
| Immigrants | Cameroon | 97.3 /100 | #102 | Exceptional 19.8% |
| Immigrants | Southern Europe | 97.1 /100 | #103 | Exceptional 19.9% |
| Chileans | 96.9 /100 | #104 | Exceptional 19.9% |