Spaniard vs Immigrants from Western Asia Single Female Poverty
COMPARE
Spaniard
Immigrants from Western Asia
Single Female Poverty
Single Female Poverty Comparison
Spaniards
Immigrants from Western Asia
22.0%
SINGLE FEMALE POVERTY
4.7/ 100
METRIC RATING
233rd/ 347
METRIC RANK
19.9%
SINGLE FEMALE POVERTY
96.5/ 100
METRIC RATING
110th/ 347
METRIC RANK
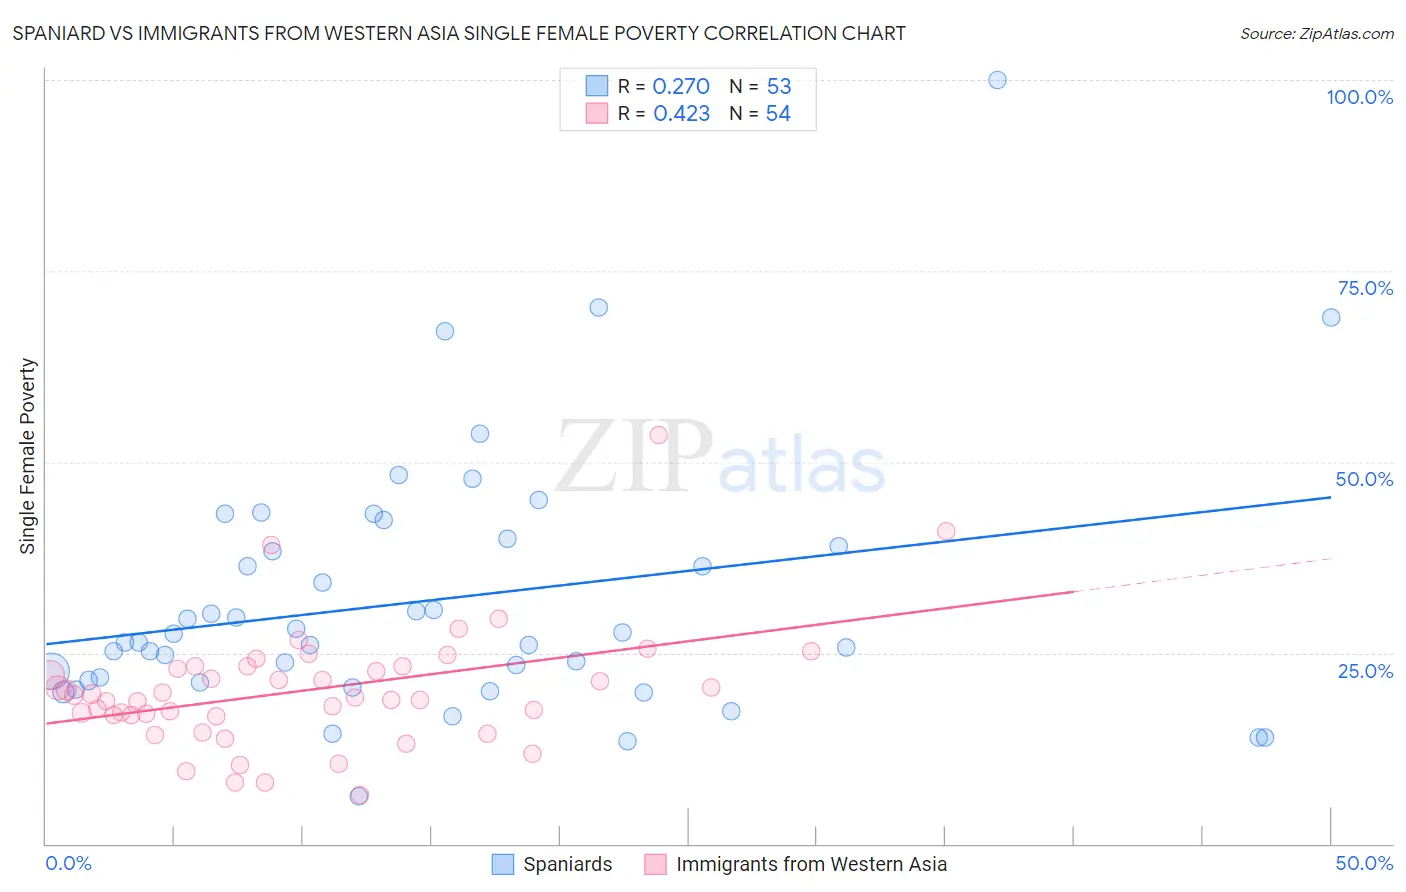
Spaniard vs Immigrants from Western Asia Single Female Poverty Correlation Chart
The statistical analysis conducted on geographies consisting of 435,429,561 people shows a weak positive correlation between the proportion of Spaniards and poverty level among single females in the United States with a correlation coefficient (R) of 0.270 and weighted average of 22.0%. Similarly, the statistical analysis conducted on geographies consisting of 397,084,795 people shows a moderate positive correlation between the proportion of Immigrants from Western Asia and poverty level among single females in the United States with a correlation coefficient (R) of 0.423 and weighted average of 19.9%, a difference of 10.4%.
Single Female Poverty Correlation Summary
| Measurement | Spaniard | Immigrants from Western Asia |
| Minimum | 6.3% | 6.4% |
| Maximum | 100.0% | 53.6% |
| Range | 93.7% | 47.2% |
| Mean | 31.9% | 20.1% |
| Median | 26.3% | 19.3% |
| Interquartile 25% (IQ1) | 21.2% | 16.8% |
| Interquartile 75% (IQ3) | 39.4% | 23.2% |
| Interquartile Range (IQR) | 18.2% | 6.4% |
| Standard Deviation (Sample) | 16.8% | 8.0% |
| Standard Deviation (Population) | 16.6% | 7.9% |
Similar Demographics by Single Female Poverty
Demographics Similar to Spaniards by Single Female Poverty
In terms of single female poverty, the demographic groups most similar to Spaniards are Spanish (22.0%, a difference of 0.0%), Dutch (22.0%, a difference of 0.020%), Immigrants from Thailand (22.0%, a difference of 0.090%), Welsh (22.0%, a difference of 0.11%), and Immigrants from Ecuador (22.0%, a difference of 0.18%).
| Demographics | Rating | Rank | Single Female Poverty |
| Immigrants | Portugal | 5.8 /100 | #226 | Tragic 21.9% |
| Immigrants | Ghana | 5.8 /100 | #227 | Tragic 21.9% |
| Salvadorans | 5.5 /100 | #228 | Tragic 21.9% |
| Tlingit-Haida | 5.4 /100 | #229 | Tragic 21.9% |
| Immigrants | Western Africa | 5.3 /100 | #230 | Tragic 22.0% |
| Welsh | 5.0 /100 | #231 | Tragic 22.0% |
| Immigrants | Thailand | 5.0 /100 | #232 | Tragic 22.0% |
| Spaniards | 4.7 /100 | #233 | Tragic 22.0% |
| Spanish | 4.7 /100 | #234 | Tragic 22.0% |
| Dutch | 4.6 /100 | #235 | Tragic 22.0% |
| Immigrants | Ecuador | 4.2 /100 | #236 | Tragic 22.0% |
| Vietnamese | 4.0 /100 | #237 | Tragic 22.0% |
| French Canadians | 2.8 /100 | #238 | Tragic 22.2% |
| Malaysians | 2.8 /100 | #239 | Tragic 22.2% |
| French | 2.3 /100 | #240 | Tragic 22.2% |
Demographics Similar to Immigrants from Western Asia by Single Female Poverty
In terms of single female poverty, the demographic groups most similar to Immigrants from Western Asia are Colombian (19.9%, a difference of 0.010%), Native Hawaiian (19.9%, a difference of 0.020%), Immigrants from Syria (19.9%, a difference of 0.070%), Ethiopian (19.9%, a difference of 0.080%), and Israeli (19.9%, a difference of 0.18%).
| Demographics | Rating | Rank | Single Female Poverty |
| Immigrants | Southern Europe | 97.1 /100 | #103 | Exceptional 19.9% |
| Chileans | 96.9 /100 | #104 | Exceptional 19.9% |
| Israelis | 96.9 /100 | #105 | Exceptional 19.9% |
| Ethiopians | 96.7 /100 | #106 | Exceptional 19.9% |
| Immigrants | Syria | 96.7 /100 | #107 | Exceptional 19.9% |
| Native Hawaiians | 96.6 /100 | #108 | Exceptional 19.9% |
| Colombians | 96.6 /100 | #109 | Exceptional 19.9% |
| Immigrants | Western Asia | 96.5 /100 | #110 | Exceptional 19.9% |
| Carpatho Rusyns | 96.1 /100 | #111 | Exceptional 20.0% |
| Immigrants | Netherlands | 96.0 /100 | #112 | Exceptional 20.0% |
| Immigrants | Zimbabwe | 95.9 /100 | #113 | Exceptional 20.0% |
| Immigrants | Colombia | 95.9 /100 | #114 | Exceptional 20.0% |
| Immigrants | Northern Africa | 95.8 /100 | #115 | Exceptional 20.0% |
| Immigrants | Kazakhstan | 95.7 /100 | #116 | Exceptional 20.0% |
| Poles | 95.6 /100 | #117 | Exceptional 20.0% |