Spaniard vs Immigrants from Western Asia Seniors Poverty Over the Age of 75
COMPARE
Spaniard
Immigrants from Western Asia
Seniors Poverty Over the Age of 75
Seniors Poverty Over the Age of 75 Comparison
Spaniards
Immigrants from Western Asia
12.2%
SENIORS POVERTY OVER THE AGE OF 75
51.6/ 100
METRIC RATING
171st/ 347
METRIC RANK
12.9%
SENIORS POVERTY OVER THE AGE OF 75
4.9/ 100
METRIC RATING
218th/ 347
METRIC RANK
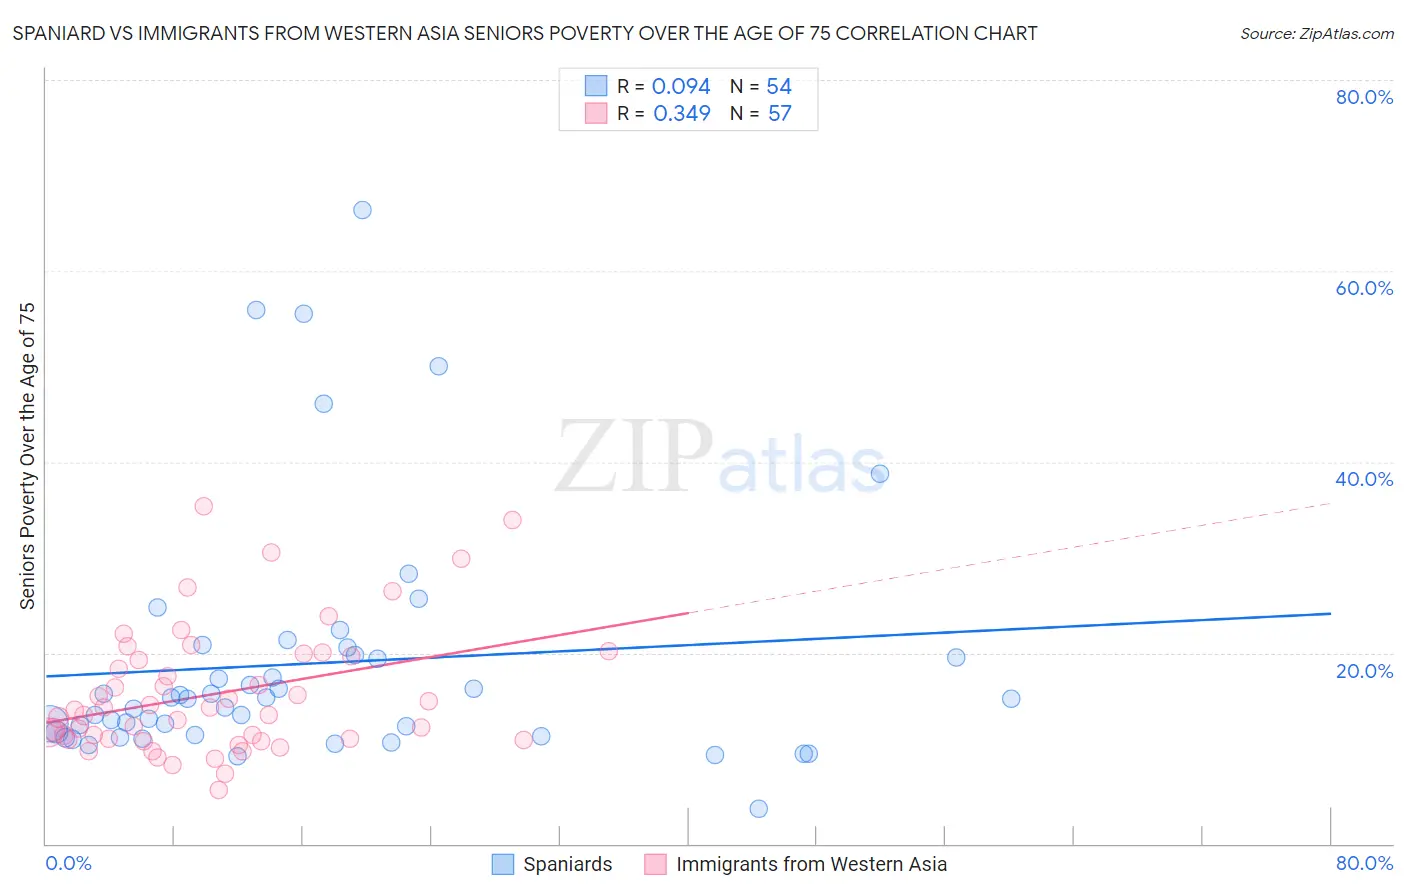
Spaniard vs Immigrants from Western Asia Seniors Poverty Over the Age of 75 Correlation Chart
The statistical analysis conducted on geographies consisting of 437,059,242 people shows a slight positive correlation between the proportion of Spaniards and poverty level among seniors over the age of 75 in the United States with a correlation coefficient (R) of 0.094 and weighted average of 12.2%. Similarly, the statistical analysis conducted on geographies consisting of 399,569,345 people shows a mild positive correlation between the proportion of Immigrants from Western Asia and poverty level among seniors over the age of 75 in the United States with a correlation coefficient (R) of 0.349 and weighted average of 12.9%, a difference of 6.2%.
Seniors Poverty Over the Age of 75 Correlation Summary
| Measurement | Spaniard | Immigrants from Western Asia |
| Minimum | 3.6% | 5.6% |
| Maximum | 66.4% | 35.3% |
| Range | 62.8% | 29.7% |
| Mean | 18.9% | 15.7% |
| Median | 15.2% | 14.0% |
| Interquartile 25% (IQ1) | 11.4% | 10.9% |
| Interquartile 75% (IQ3) | 19.8% | 19.7% |
| Interquartile Range (IQR) | 8.4% | 8.8% |
| Standard Deviation (Sample) | 13.0% | 6.6% |
| Standard Deviation (Population) | 12.9% | 6.6% |
Similar Demographics by Seniors Poverty Over the Age of 75
Demographics Similar to Spaniards by Seniors Poverty Over the Age of 75
In terms of seniors poverty over the age of 75, the demographic groups most similar to Spaniards are Immigrants from Fiji (12.2%, a difference of 0.010%), Immigrants from Thailand (12.2%, a difference of 0.030%), Arab (12.2%, a difference of 0.090%), Immigrants from Europe (12.2%, a difference of 0.13%), and Immigrants from Saudi Arabia (12.2%, a difference of 0.17%).
| Demographics | Rating | Rank | Seniors Poverty Over the Age of 75 |
| Potawatomi | 57.4 /100 | #164 | Average 12.1% |
| Okinawans | 56.3 /100 | #165 | Average 12.1% |
| Egyptians | 54.8 /100 | #166 | Average 12.1% |
| Immigrants | Switzerland | 54.5 /100 | #167 | Average 12.1% |
| Immigrants | Syria | 53.9 /100 | #168 | Average 12.2% |
| Immigrants | Egypt | 53.7 /100 | #169 | Average 12.2% |
| Immigrants | Thailand | 52.0 /100 | #170 | Average 12.2% |
| Spaniards | 51.6 /100 | #171 | Average 12.2% |
| Immigrants | Fiji | 51.5 /100 | #172 | Average 12.2% |
| Arabs | 50.5 /100 | #173 | Average 12.2% |
| Immigrants | Europe | 50.0 /100 | #174 | Average 12.2% |
| Immigrants | Saudi Arabia | 49.5 /100 | #175 | Average 12.2% |
| Immigrants | Iran | 48.1 /100 | #176 | Average 12.2% |
| Immigrants | Asia | 47.8 /100 | #177 | Average 12.2% |
| Immigrants | Nonimmigrants | 46.8 /100 | #178 | Average 12.2% |
Demographics Similar to Immigrants from Western Asia by Seniors Poverty Over the Age of 75
In terms of seniors poverty over the age of 75, the demographic groups most similar to Immigrants from Western Asia are Bermudan (12.9%, a difference of 0.030%), Ute (12.9%, a difference of 0.060%), Immigrants from Brazil (12.9%, a difference of 0.12%), Seminole (12.9%, a difference of 0.17%), and South American Indian (12.9%, a difference of 0.24%).
| Demographics | Rating | Rank | Seniors Poverty Over the Age of 75 |
| Brazilians | 6.9 /100 | #211 | Tragic 12.8% |
| Immigrants | Hong Kong | 6.5 /100 | #212 | Tragic 12.8% |
| French American Indians | 6.1 /100 | #213 | Tragic 12.9% |
| Immigrants | Africa | 5.9 /100 | #214 | Tragic 12.9% |
| South American Indians | 5.5 /100 | #215 | Tragic 12.9% |
| Immigrants | Brazil | 5.2 /100 | #216 | Tragic 12.9% |
| Bermudans | 4.9 /100 | #217 | Tragic 12.9% |
| Immigrants | Western Asia | 4.9 /100 | #218 | Tragic 12.9% |
| Ute | 4.7 /100 | #219 | Tragic 12.9% |
| Seminole | 4.5 /100 | #220 | Tragic 12.9% |
| Immigrants | Kazakhstan | 4.3 /100 | #221 | Tragic 13.0% |
| Nigerians | 3.4 /100 | #222 | Tragic 13.0% |
| Immigrants | Nigeria | 3.3 /100 | #223 | Tragic 13.0% |
| Chippewa | 2.9 /100 | #224 | Tragic 13.1% |
| Immigrants | Morocco | 2.8 /100 | #225 | Tragic 13.1% |