Spaniard vs Immigrants from Eastern Africa Median Female Earnings
COMPARE
Spaniard
Immigrants from Eastern Africa
Median Female Earnings
Median Female Earnings Comparison
Spaniards
Immigrants from Eastern Africa
$38,656
MEDIAN FEMALE EARNINGS
10.3/ 100
METRIC RATING
215th/ 347
METRIC RANK
$40,644
MEDIAN FEMALE EARNINGS
87.7/ 100
METRIC RATING
136th/ 347
METRIC RANK
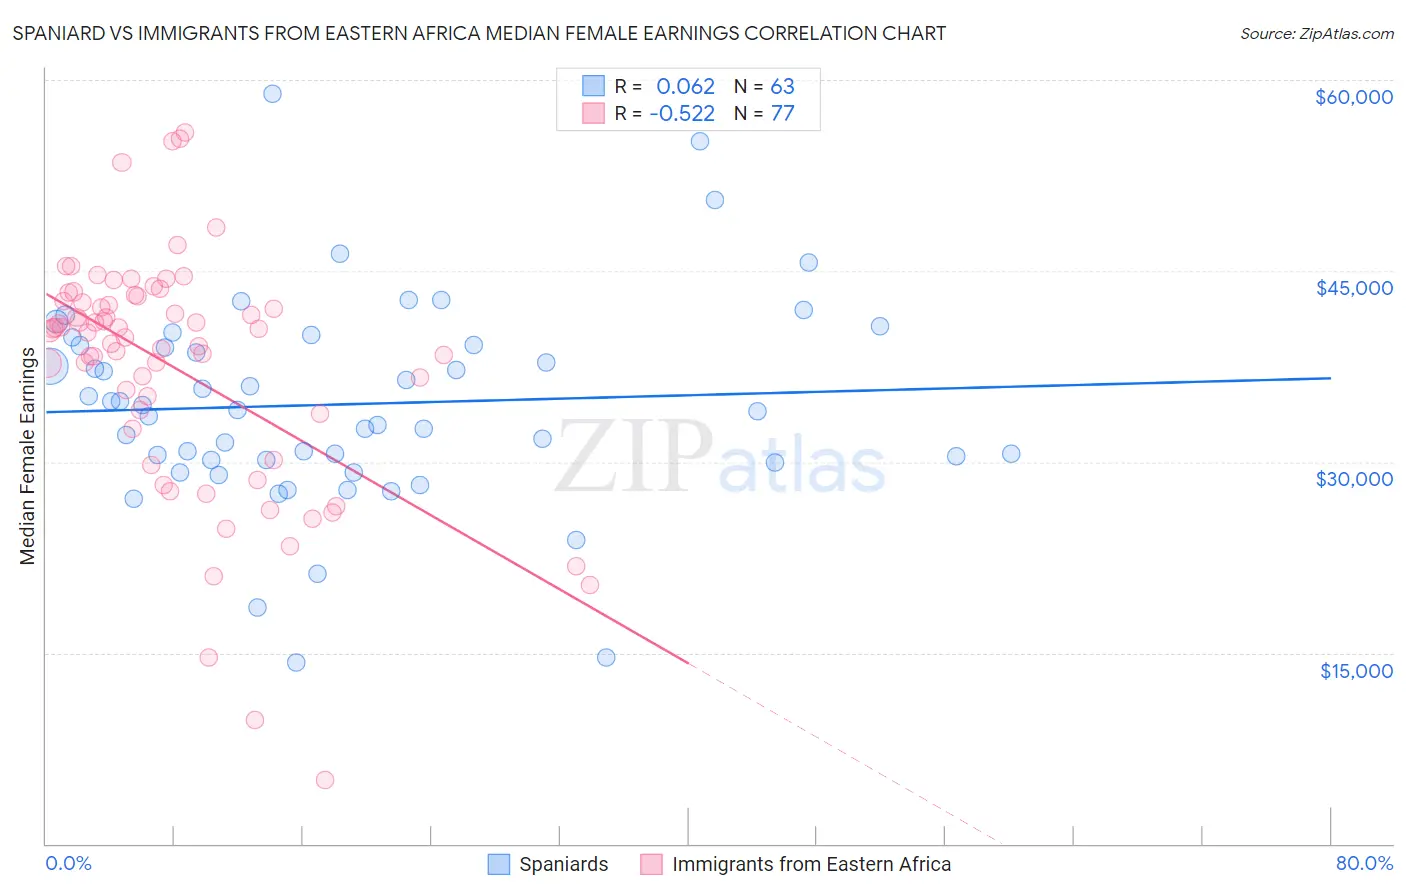
Spaniard vs Immigrants from Eastern Africa Median Female Earnings Correlation Chart
The statistical analysis conducted on geographies consisting of 443,223,610 people shows a slight positive correlation between the proportion of Spaniards and median female earnings in the United States with a correlation coefficient (R) of 0.062 and weighted average of $38,656. Similarly, the statistical analysis conducted on geographies consisting of 355,081,217 people shows a substantial negative correlation between the proportion of Immigrants from Eastern Africa and median female earnings in the United States with a correlation coefficient (R) of -0.522 and weighted average of $40,644, a difference of 5.1%.
Median Female Earnings Correlation Summary
| Measurement | Spaniard | Immigrants from Eastern Africa |
| Minimum | $14,192 | $5,000 |
| Maximum | $58,909 | $55,898 |
| Range | $44,717 | $50,898 |
| Mean | $34,527 | $37,373 |
| Median | $34,038 | $40,248 |
| Interquartile 25% (IQ1) | $30,169 | $33,197 |
| Interquartile 75% (IQ3) | $39,139 | $42,814 |
| Interquartile Range (IQR) | $8,970 | $9,617 |
| Standard Deviation (Sample) | $8,078 | $9,538 |
| Standard Deviation (Population) | $8,014 | $9,476 |
Similar Demographics by Median Female Earnings
Demographics Similar to Spaniards by Median Female Earnings
In terms of median female earnings, the demographic groups most similar to Spaniards are Iraqi ($38,666, a difference of 0.020%), Jamaican ($38,670, a difference of 0.030%), Immigrants from Ecuador ($38,644, a difference of 0.030%), Immigrants from Jamaica ($38,625, a difference of 0.080%), and Cape Verdean ($38,614, a difference of 0.11%).
| Demographics | Rating | Rank | Median Female Earnings |
| Immigrants | Thailand | 13.6 /100 | #208 | Poor $38,810 |
| Norwegians | 13.4 /100 | #209 | Poor $38,802 |
| Czechoslovakians | 12.0 /100 | #210 | Poor $38,738 |
| Aleuts | 11.6 /100 | #211 | Poor $38,719 |
| Guamanians/Chamorros | 11.5 /100 | #212 | Poor $38,717 |
| Jamaicans | 10.5 /100 | #213 | Poor $38,670 |
| Iraqis | 10.5 /100 | #214 | Poor $38,666 |
| Spaniards | 10.3 /100 | #215 | Poor $38,656 |
| Immigrants | Ecuador | 10.1 /100 | #216 | Poor $38,644 |
| Immigrants | Jamaica | 9.7 /100 | #217 | Tragic $38,625 |
| Cape Verdeans | 9.5 /100 | #218 | Tragic $38,614 |
| Nepalese | 9.3 /100 | #219 | Tragic $38,603 |
| Yugoslavians | 8.8 /100 | #220 | Tragic $38,573 |
| Immigrants | Azores | 8.8 /100 | #221 | Tragic $38,573 |
| Japanese | 8.1 /100 | #222 | Tragic $38,528 |
Demographics Similar to Immigrants from Eastern Africa by Median Female Earnings
In terms of median female earnings, the demographic groups most similar to Immigrants from Eastern Africa are Pakistani ($40,596, a difference of 0.12%), Immigrants from Nepal ($40,704, a difference of 0.15%), Taiwanese ($40,576, a difference of 0.17%), Arab ($40,718, a difference of 0.18%), and Syrian ($40,727, a difference of 0.20%).
| Demographics | Rating | Rank | Median Female Earnings |
| Zimbabweans | 90.8 /100 | #129 | Exceptional $40,798 |
| Immigrants | Guyana | 90.3 /100 | #130 | Exceptional $40,773 |
| Chileans | 90.0 /100 | #131 | Exceptional $40,757 |
| Immigrants | Uganda | 89.7 /100 | #132 | Excellent $40,739 |
| Syrians | 89.5 /100 | #133 | Excellent $40,727 |
| Arabs | 89.3 /100 | #134 | Excellent $40,718 |
| Immigrants | Nepal | 89.0 /100 | #135 | Excellent $40,704 |
| Immigrants | Eastern Africa | 87.7 /100 | #136 | Excellent $40,644 |
| Pakistanis | 86.6 /100 | #137 | Excellent $40,596 |
| Taiwanese | 86.1 /100 | #138 | Excellent $40,576 |
| Immigrants | South Eastern Asia | 85.7 /100 | #139 | Excellent $40,558 |
| Serbians | 85.2 /100 | #140 | Excellent $40,539 |
| Immigrants | Syria | 84.1 /100 | #141 | Excellent $40,499 |
| Sri Lankans | 84.0 /100 | #142 | Excellent $40,496 |
| Northern Europeans | 83.9 /100 | #143 | Excellent $40,491 |