Somali vs Ute Male Poverty
COMPARE
Somali
Ute
Male Poverty
Male Poverty Comparison
Somalis
Ute
14.3%
MALE POVERTY
0.0/ 100
METRIC RATING
309th/ 347
METRIC RANK
16.2%
MALE POVERTY
0.0/ 100
METRIC RATING
331st/ 347
METRIC RANK
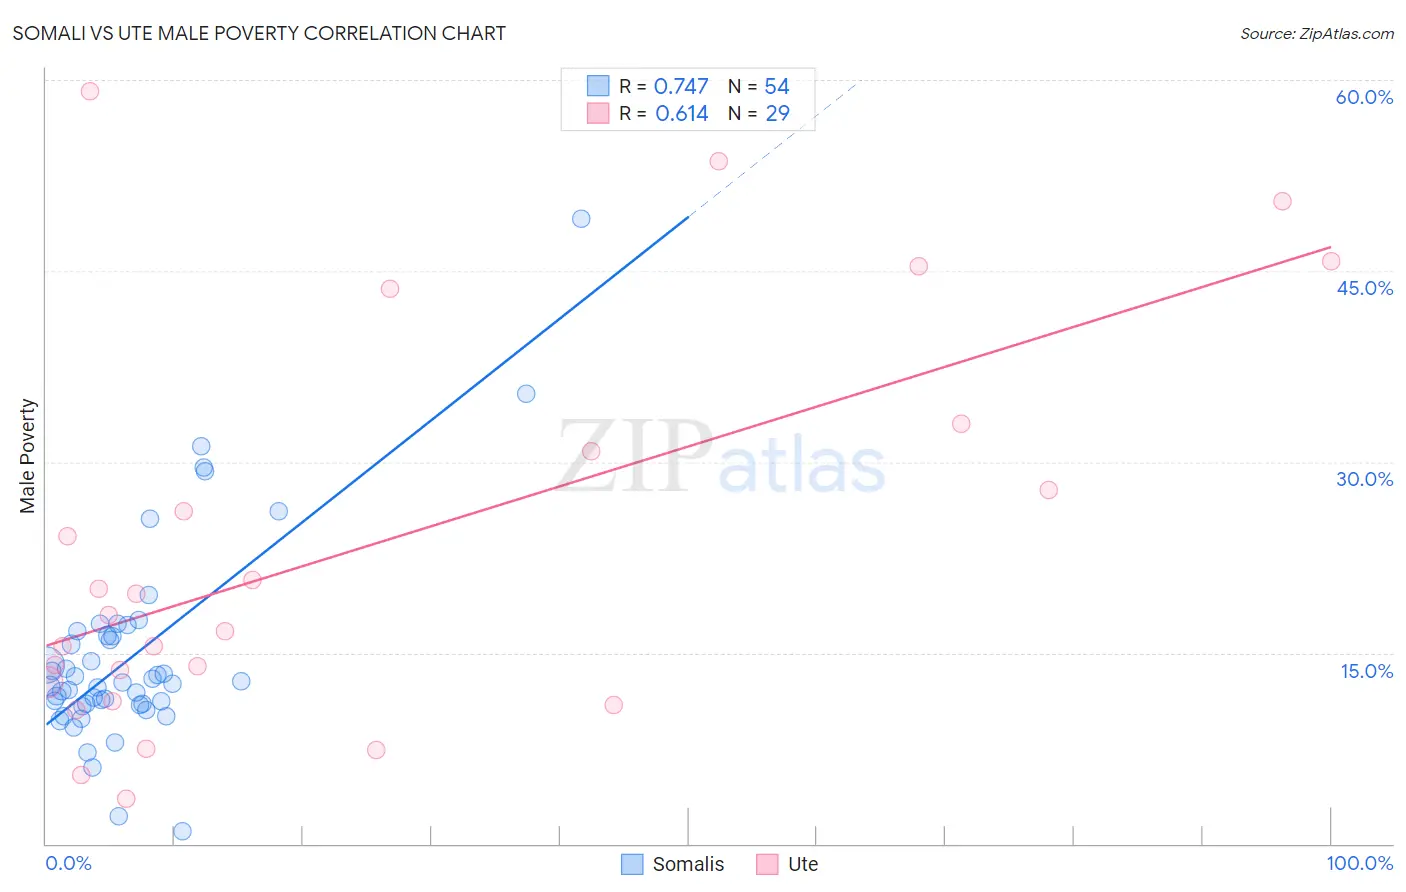
Somali vs Ute Male Poverty Correlation Chart
The statistical analysis conducted on geographies consisting of 99,289,063 people shows a strong positive correlation between the proportion of Somalis and poverty level among males in the United States with a correlation coefficient (R) of 0.747 and weighted average of 14.3%. Similarly, the statistical analysis conducted on geographies consisting of 55,650,694 people shows a significant positive correlation between the proportion of Ute and poverty level among males in the United States with a correlation coefficient (R) of 0.614 and weighted average of 16.2%, a difference of 13.9%.
Male Poverty Correlation Summary
| Measurement | Somali | Ute |
| Minimum | 1.0% | 3.5% |
| Maximum | 49.1% | 59.1% |
| Range | 48.1% | 55.6% |
| Mean | 14.8% | 23.3% |
| Median | 12.6% | 17.9% |
| Interquartile 25% (IQ1) | 10.9% | 12.0% |
| Interquartile 75% (IQ3) | 16.4% | 31.9% |
| Interquartile Range (IQR) | 5.4% | 20.0% |
| Standard Deviation (Sample) | 8.1% | 15.6% |
| Standard Deviation (Population) | 8.0% | 15.3% |
Similar Demographics by Male Poverty
Demographics Similar to Somalis by Male Poverty
In terms of male poverty, the demographic groups most similar to Somalis are Seminole (14.3%, a difference of 0.20%), African (14.2%, a difference of 0.38%), Dutch West Indian (14.2%, a difference of 0.40%), Honduran (14.3%, a difference of 0.41%), and Choctaw (14.4%, a difference of 0.88%).
| Demographics | Rating | Rank | Male Poverty |
| Immigrants | Caribbean | 0.0 /100 | #302 | Tragic 14.0% |
| Bahamians | 0.0 /100 | #303 | Tragic 14.1% |
| Senegalese | 0.0 /100 | #304 | Tragic 14.1% |
| Immigrants | Bangladesh | 0.0 /100 | #305 | Tragic 14.1% |
| Creek | 0.0 /100 | #306 | Tragic 14.1% |
| Dutch West Indians | 0.0 /100 | #307 | Tragic 14.2% |
| Africans | 0.0 /100 | #308 | Tragic 14.2% |
| Somalis | 0.0 /100 | #309 | Tragic 14.3% |
| Seminole | 0.0 /100 | #310 | Tragic 14.3% |
| Hondurans | 0.0 /100 | #311 | Tragic 14.3% |
| Choctaw | 0.0 /100 | #312 | Tragic 14.4% |
| Immigrants | Somalia | 0.0 /100 | #313 | Tragic 14.6% |
| Immigrants | Honduras | 0.0 /100 | #314 | Tragic 14.6% |
| Chippewa | 0.0 /100 | #315 | Tragic 14.6% |
| British West Indians | 0.0 /100 | #316 | Tragic 14.6% |
Demographics Similar to Ute by Male Poverty
In terms of male poverty, the demographic groups most similar to Ute are Immigrants from Dominican Republic (16.2%, a difference of 0.34%), Dominican (16.1%, a difference of 0.99%), Black/African American (15.8%, a difference of 2.7%), Paiute (15.8%, a difference of 2.8%), and Houma (16.7%, a difference of 3.0%).
| Demographics | Rating | Rank | Male Poverty |
| Menominee | 0.0 /100 | #324 | Tragic 15.3% |
| Yakama | 0.0 /100 | #325 | Tragic 15.3% |
| Central American Indians | 0.0 /100 | #326 | Tragic 15.3% |
| Paiute | 0.0 /100 | #327 | Tragic 15.8% |
| Blacks/African Americans | 0.0 /100 | #328 | Tragic 15.8% |
| Dominicans | 0.0 /100 | #329 | Tragic 16.1% |
| Immigrants | Dominican Republic | 0.0 /100 | #330 | Tragic 16.2% |
| Ute | 0.0 /100 | #331 | Tragic 16.2% |
| Houma | 0.0 /100 | #332 | Tragic 16.7% |
| Natives/Alaskans | 0.0 /100 | #333 | Tragic 16.9% |
| Cheyenne | 0.0 /100 | #334 | Tragic 17.6% |
| Apache | 0.0 /100 | #335 | Tragic 17.7% |
| Pueblo | 0.0 /100 | #336 | Tragic 18.5% |
| Sioux | 0.0 /100 | #337 | Tragic 18.7% |
| Crow | 0.0 /100 | #338 | Tragic 19.1% |