Tsimshian vs Ute Male Poverty
COMPARE
Tsimshian
Ute
Male Poverty
Male Poverty Comparison
Tsimshian
Ute
12.8%
MALE POVERTY
0.3/ 100
METRIC RATING
244th/ 347
METRIC RANK
16.2%
MALE POVERTY
0.0/ 100
METRIC RATING
331st/ 347
METRIC RANK
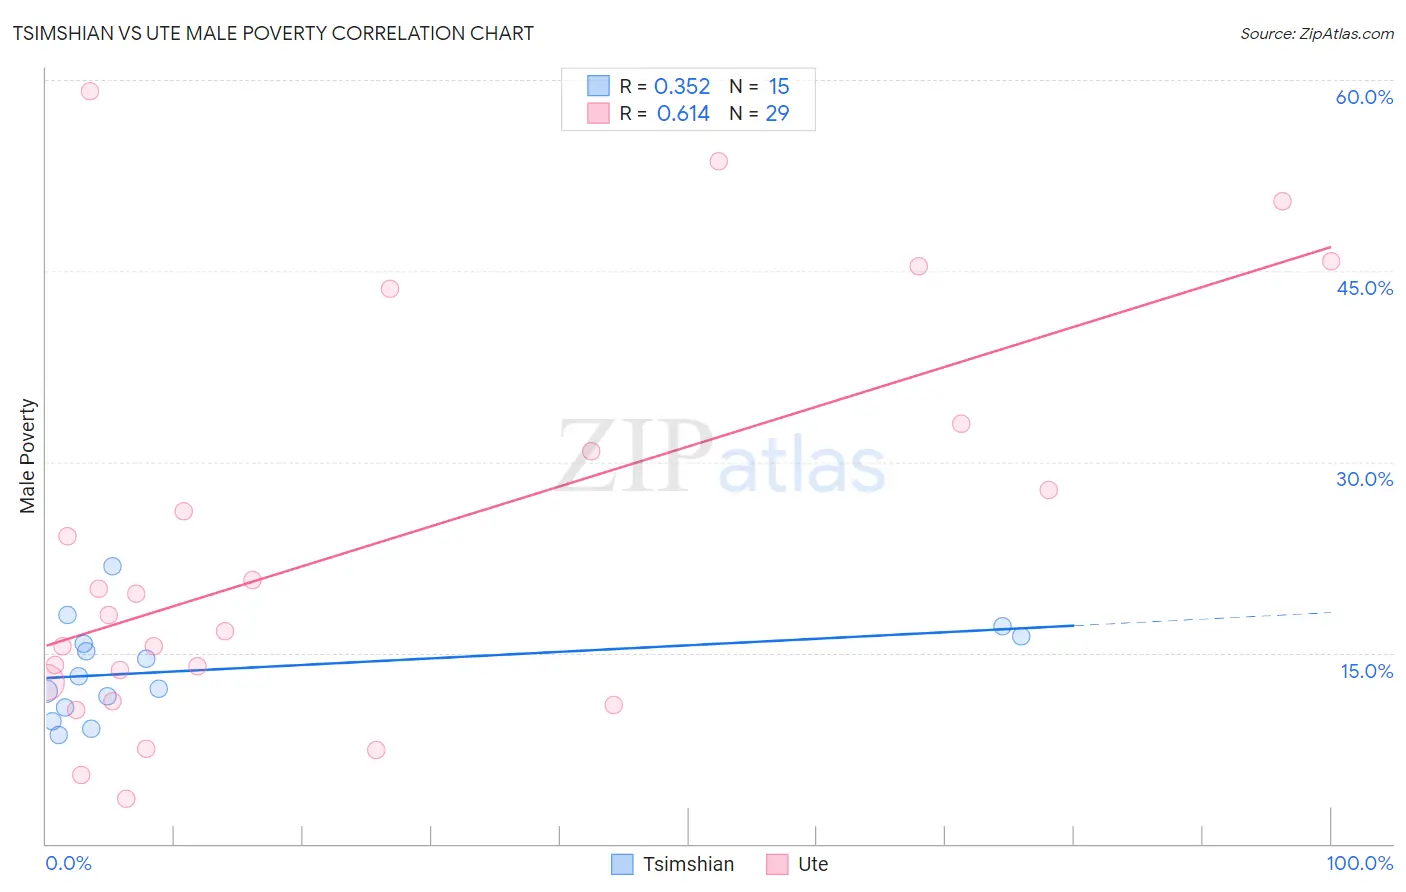
Tsimshian vs Ute Male Poverty Correlation Chart
The statistical analysis conducted on geographies consisting of 15,624,889 people shows a mild positive correlation between the proportion of Tsimshian and poverty level among males in the United States with a correlation coefficient (R) of 0.352 and weighted average of 12.8%. Similarly, the statistical analysis conducted on geographies consisting of 55,650,694 people shows a significant positive correlation between the proportion of Ute and poverty level among males in the United States with a correlation coefficient (R) of 0.614 and weighted average of 16.2%, a difference of 26.9%.
Male Poverty Correlation Summary
| Measurement | Tsimshian | Ute |
| Minimum | 8.5% | 3.5% |
| Maximum | 21.8% | 59.1% |
| Range | 13.2% | 55.6% |
| Mean | 13.7% | 23.3% |
| Median | 13.1% | 17.9% |
| Interquartile 25% (IQ1) | 10.7% | 12.0% |
| Interquartile 75% (IQ3) | 16.3% | 31.9% |
| Interquartile Range (IQR) | 5.6% | 20.0% |
| Standard Deviation (Sample) | 3.7% | 15.6% |
| Standard Deviation (Population) | 3.6% | 15.3% |
Similar Demographics by Male Poverty
Demographics Similar to Tsimshian by Male Poverty
In terms of male poverty, the demographic groups most similar to Tsimshian are Liberian (12.8%, a difference of 0.010%), Alaskan Athabascan (12.8%, a difference of 0.11%), Nepalese (12.8%, a difference of 0.14%), Sudanese (12.8%, a difference of 0.31%), and Immigrants from El Salvador (12.8%, a difference of 0.32%).
| Demographics | Rating | Rank | Male Poverty |
| French American Indians | 0.4 /100 | #237 | Tragic 12.7% |
| Ecuadorians | 0.4 /100 | #238 | Tragic 12.7% |
| Ghanaians | 0.4 /100 | #239 | Tragic 12.7% |
| Immigrants | Middle Africa | 0.4 /100 | #240 | Tragic 12.7% |
| Sudanese | 0.3 /100 | #241 | Tragic 12.8% |
| Nepalese | 0.3 /100 | #242 | Tragic 12.8% |
| Alaskan Athabascans | 0.3 /100 | #243 | Tragic 12.8% |
| Tsimshian | 0.3 /100 | #244 | Tragic 12.8% |
| Liberians | 0.3 /100 | #245 | Tragic 12.8% |
| Immigrants | El Salvador | 0.2 /100 | #246 | Tragic 12.8% |
| Immigrants | Western Africa | 0.2 /100 | #247 | Tragic 12.9% |
| Immigrants | Sudan | 0.2 /100 | #248 | Tragic 12.9% |
| Potawatomi | 0.2 /100 | #249 | Tragic 12.9% |
| Immigrants | Nicaragua | 0.2 /100 | #250 | Tragic 12.9% |
| Immigrants | Cuba | 0.2 /100 | #251 | Tragic 12.9% |
Demographics Similar to Ute by Male Poverty
In terms of male poverty, the demographic groups most similar to Ute are Immigrants from Dominican Republic (16.2%, a difference of 0.34%), Dominican (16.1%, a difference of 0.99%), Black/African American (15.8%, a difference of 2.7%), Paiute (15.8%, a difference of 2.8%), and Houma (16.7%, a difference of 3.0%).
| Demographics | Rating | Rank | Male Poverty |
| Menominee | 0.0 /100 | #324 | Tragic 15.3% |
| Yakama | 0.0 /100 | #325 | Tragic 15.3% |
| Central American Indians | 0.0 /100 | #326 | Tragic 15.3% |
| Paiute | 0.0 /100 | #327 | Tragic 15.8% |
| Blacks/African Americans | 0.0 /100 | #328 | Tragic 15.8% |
| Dominicans | 0.0 /100 | #329 | Tragic 16.1% |
| Immigrants | Dominican Republic | 0.0 /100 | #330 | Tragic 16.2% |
| Ute | 0.0 /100 | #331 | Tragic 16.2% |
| Houma | 0.0 /100 | #332 | Tragic 16.7% |
| Natives/Alaskans | 0.0 /100 | #333 | Tragic 16.9% |
| Cheyenne | 0.0 /100 | #334 | Tragic 17.6% |
| Apache | 0.0 /100 | #335 | Tragic 17.7% |
| Pueblo | 0.0 /100 | #336 | Tragic 18.5% |
| Sioux | 0.0 /100 | #337 | Tragic 18.7% |
| Crow | 0.0 /100 | #338 | Tragic 19.1% |