Somali vs Immigrants from Ecuador Male Poverty
COMPARE
Somali
Immigrants from Ecuador
Male Poverty
Male Poverty Comparison
Somalis
Immigrants from Ecuador
14.3%
MALE POVERTY
0.0/ 100
METRIC RATING
309th/ 347
METRIC RANK
12.9%
MALE POVERTY
0.2/ 100
METRIC RATING
252nd/ 347
METRIC RANK
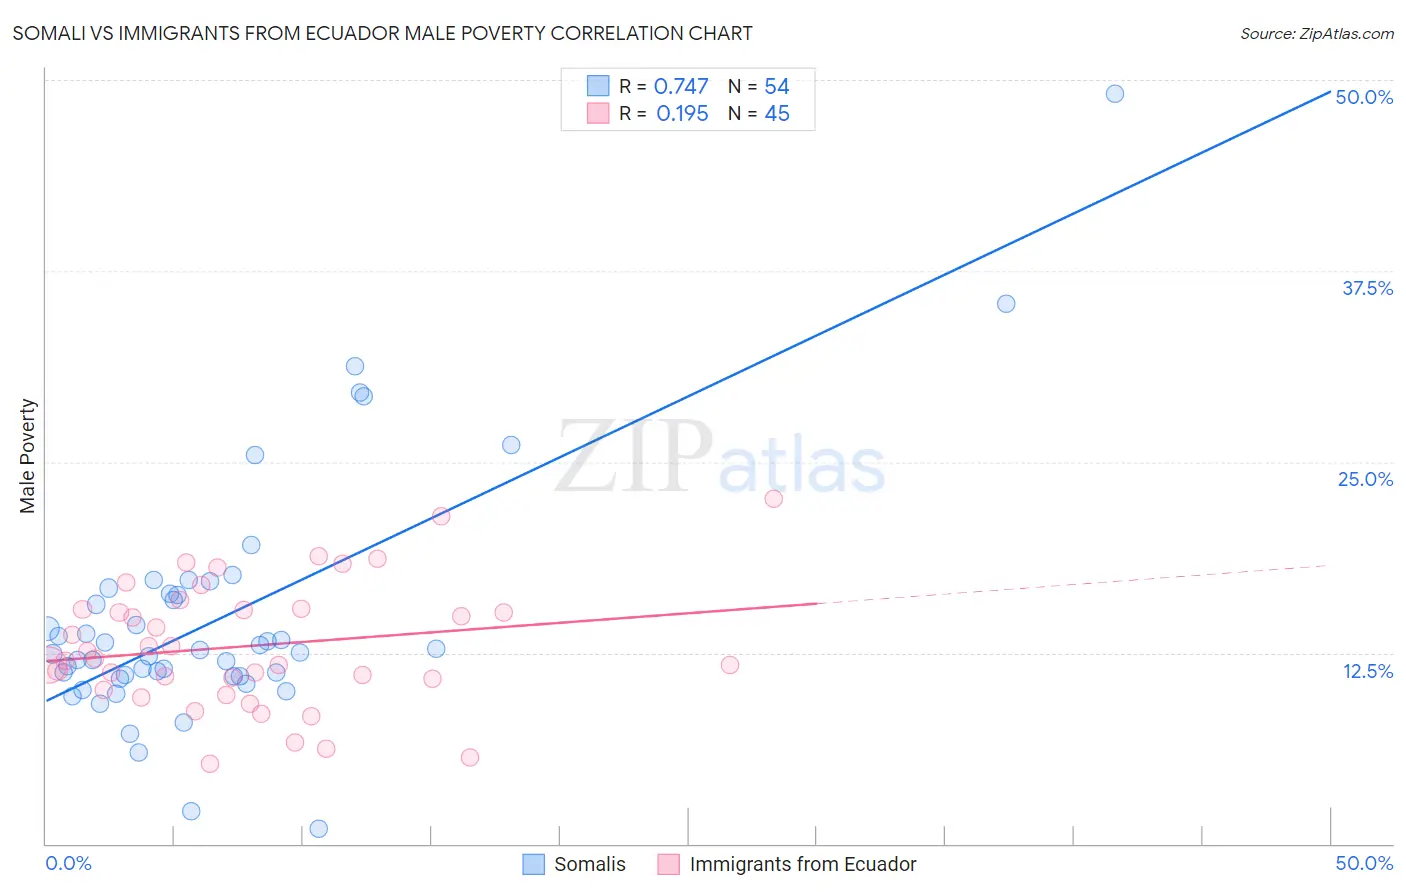
Somali vs Immigrants from Ecuador Male Poverty Correlation Chart
The statistical analysis conducted on geographies consisting of 99,289,063 people shows a strong positive correlation between the proportion of Somalis and poverty level among males in the United States with a correlation coefficient (R) of 0.747 and weighted average of 14.3%. Similarly, the statistical analysis conducted on geographies consisting of 270,825,114 people shows a poor positive correlation between the proportion of Immigrants from Ecuador and poverty level among males in the United States with a correlation coefficient (R) of 0.195 and weighted average of 12.9%, a difference of 10.4%.
Male Poverty Correlation Summary
| Measurement | Somali | Immigrants from Ecuador |
| Minimum | 1.0% | 5.2% |
| Maximum | 49.1% | 22.6% |
| Range | 48.1% | 17.4% |
| Mean | 14.8% | 13.0% |
| Median | 12.6% | 12.1% |
| Interquartile 25% (IQ1) | 10.9% | 10.4% |
| Interquartile 75% (IQ3) | 16.4% | 15.4% |
| Interquartile Range (IQR) | 5.4% | 4.9% |
| Standard Deviation (Sample) | 8.1% | 4.1% |
| Standard Deviation (Population) | 8.0% | 4.0% |
Similar Demographics by Male Poverty
Demographics Similar to Somalis by Male Poverty
In terms of male poverty, the demographic groups most similar to Somalis are Seminole (14.3%, a difference of 0.20%), African (14.2%, a difference of 0.38%), Dutch West Indian (14.2%, a difference of 0.40%), Honduran (14.3%, a difference of 0.41%), and Choctaw (14.4%, a difference of 0.88%).
| Demographics | Rating | Rank | Male Poverty |
| Immigrants | Caribbean | 0.0 /100 | #302 | Tragic 14.0% |
| Bahamians | 0.0 /100 | #303 | Tragic 14.1% |
| Senegalese | 0.0 /100 | #304 | Tragic 14.1% |
| Immigrants | Bangladesh | 0.0 /100 | #305 | Tragic 14.1% |
| Creek | 0.0 /100 | #306 | Tragic 14.1% |
| Dutch West Indians | 0.0 /100 | #307 | Tragic 14.2% |
| Africans | 0.0 /100 | #308 | Tragic 14.2% |
| Somalis | 0.0 /100 | #309 | Tragic 14.3% |
| Seminole | 0.0 /100 | #310 | Tragic 14.3% |
| Hondurans | 0.0 /100 | #311 | Tragic 14.3% |
| Choctaw | 0.0 /100 | #312 | Tragic 14.4% |
| Immigrants | Somalia | 0.0 /100 | #313 | Tragic 14.6% |
| Immigrants | Honduras | 0.0 /100 | #314 | Tragic 14.6% |
| Chippewa | 0.0 /100 | #315 | Tragic 14.6% |
| British West Indians | 0.0 /100 | #316 | Tragic 14.6% |
Demographics Similar to Immigrants from Ecuador by Male Poverty
In terms of male poverty, the demographic groups most similar to Immigrants from Ecuador are Immigrants from Cuba (12.9%, a difference of 0.030%), Immigrants from Ghana (12.9%, a difference of 0.050%), Immigrants from Nicaragua (12.9%, a difference of 0.13%), Potawatomi (12.9%, a difference of 0.14%), and Immigrants from Sudan (12.9%, a difference of 0.21%).
| Demographics | Rating | Rank | Male Poverty |
| Liberians | 0.3 /100 | #245 | Tragic 12.8% |
| Immigrants | El Salvador | 0.2 /100 | #246 | Tragic 12.8% |
| Immigrants | Western Africa | 0.2 /100 | #247 | Tragic 12.9% |
| Immigrants | Sudan | 0.2 /100 | #248 | Tragic 12.9% |
| Potawatomi | 0.2 /100 | #249 | Tragic 12.9% |
| Immigrants | Nicaragua | 0.2 /100 | #250 | Tragic 12.9% |
| Immigrants | Cuba | 0.2 /100 | #251 | Tragic 12.9% |
| Immigrants | Ecuador | 0.2 /100 | #252 | Tragic 12.9% |
| Immigrants | Ghana | 0.2 /100 | #253 | Tragic 12.9% |
| Mexican American Indians | 0.1 /100 | #254 | Tragic 13.0% |
| Immigrants | Liberia | 0.1 /100 | #255 | Tragic 13.0% |
| Immigrants | Burma/Myanmar | 0.1 /100 | #256 | Tragic 13.0% |
| Immigrants | Trinidad and Tobago | 0.1 /100 | #257 | Tragic 13.1% |
| Cape Verdeans | 0.1 /100 | #258 | Tragic 13.1% |
| Cherokee | 0.1 /100 | #259 | Tragic 13.1% |