Somali vs Czechoslovakian Male Poverty
COMPARE
Somali
Czechoslovakian
Male Poverty
Male Poverty Comparison
Somalis
Czechoslovakians
14.3%
MALE POVERTY
0.0/ 100
METRIC RATING
309th/ 347
METRIC RANK
10.3%
MALE POVERTY
95.6/ 100
METRIC RATING
84th/ 347
METRIC RANK
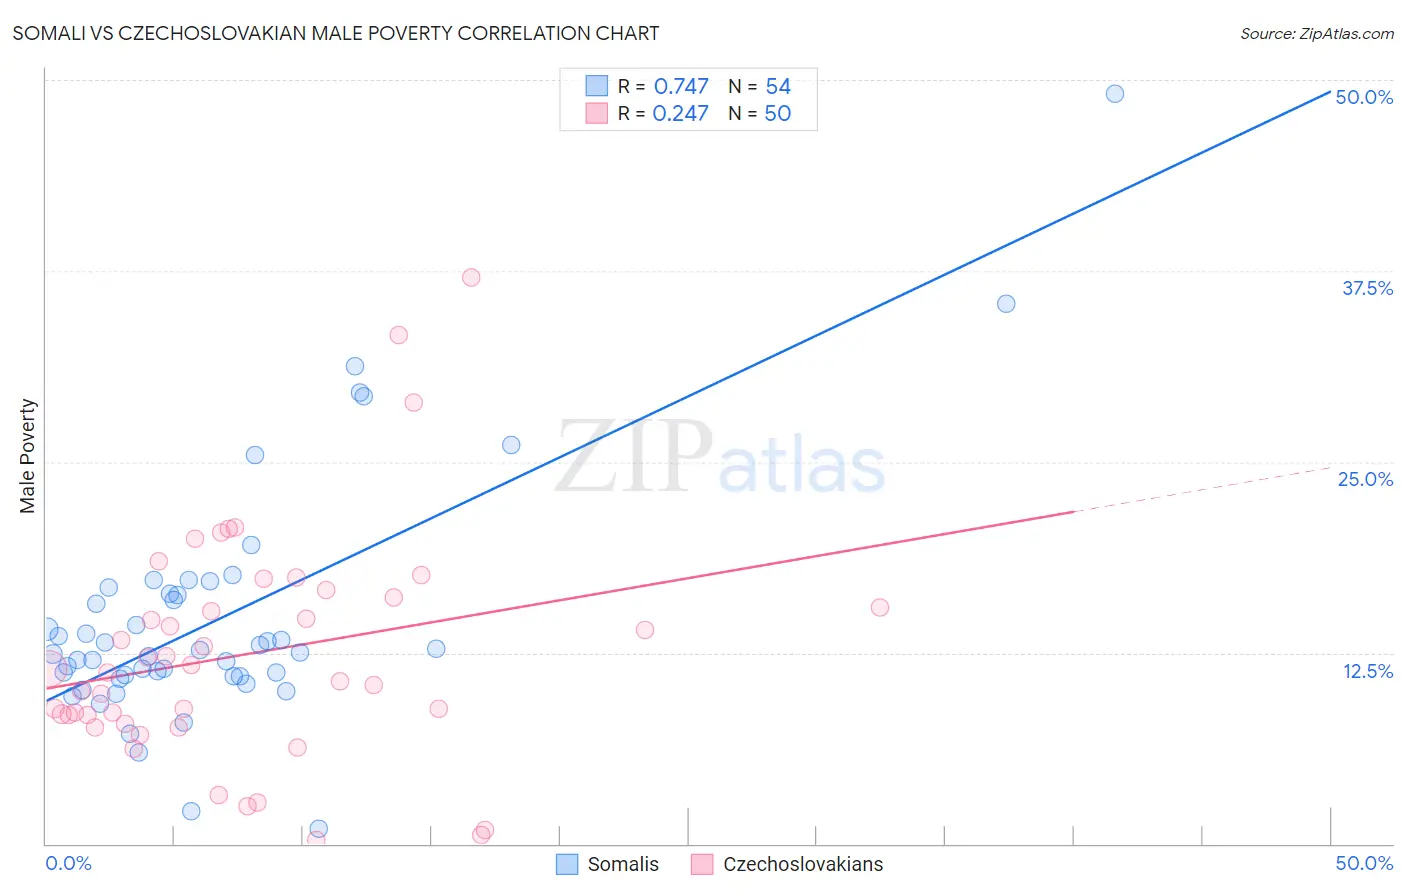
Somali vs Czechoslovakian Male Poverty Correlation Chart
The statistical analysis conducted on geographies consisting of 99,289,063 people shows a strong positive correlation between the proportion of Somalis and poverty level among males in the United States with a correlation coefficient (R) of 0.747 and weighted average of 14.3%. Similarly, the statistical analysis conducted on geographies consisting of 368,409,681 people shows a weak positive correlation between the proportion of Czechoslovakians and poverty level among males in the United States with a correlation coefficient (R) of 0.247 and weighted average of 10.3%, a difference of 37.9%.
Male Poverty Correlation Summary
| Measurement | Somali | Czechoslovakian |
| Minimum | 1.0% | 0.22% |
| Maximum | 49.1% | 37.0% |
| Range | 48.1% | 36.8% |
| Mean | 14.8% | 12.4% |
| Median | 12.6% | 11.3% |
| Interquartile 25% (IQ1) | 10.9% | 8.4% |
| Interquartile 75% (IQ3) | 16.4% | 16.1% |
| Interquartile Range (IQR) | 5.4% | 7.7% |
| Standard Deviation (Sample) | 8.1% | 7.5% |
| Standard Deviation (Population) | 8.0% | 7.4% |
Similar Demographics by Male Poverty
Demographics Similar to Somalis by Male Poverty
In terms of male poverty, the demographic groups most similar to Somalis are Seminole (14.3%, a difference of 0.20%), African (14.2%, a difference of 0.38%), Dutch West Indian (14.2%, a difference of 0.40%), Honduran (14.3%, a difference of 0.41%), and Choctaw (14.4%, a difference of 0.88%).
| Demographics | Rating | Rank | Male Poverty |
| Immigrants | Caribbean | 0.0 /100 | #302 | Tragic 14.0% |
| Bahamians | 0.0 /100 | #303 | Tragic 14.1% |
| Senegalese | 0.0 /100 | #304 | Tragic 14.1% |
| Immigrants | Bangladesh | 0.0 /100 | #305 | Tragic 14.1% |
| Creek | 0.0 /100 | #306 | Tragic 14.1% |
| Dutch West Indians | 0.0 /100 | #307 | Tragic 14.2% |
| Africans | 0.0 /100 | #308 | Tragic 14.2% |
| Somalis | 0.0 /100 | #309 | Tragic 14.3% |
| Seminole | 0.0 /100 | #310 | Tragic 14.3% |
| Hondurans | 0.0 /100 | #311 | Tragic 14.3% |
| Choctaw | 0.0 /100 | #312 | Tragic 14.4% |
| Immigrants | Somalia | 0.0 /100 | #313 | Tragic 14.6% |
| Immigrants | Honduras | 0.0 /100 | #314 | Tragic 14.6% |
| Chippewa | 0.0 /100 | #315 | Tragic 14.6% |
| British West Indians | 0.0 /100 | #316 | Tragic 14.6% |
Demographics Similar to Czechoslovakians by Male Poverty
In terms of male poverty, the demographic groups most similar to Czechoslovakians are Immigrants from England (10.4%, a difference of 0.050%), Immigrants from Sweden (10.3%, a difference of 0.060%), Immigrants from Eastern Asia (10.4%, a difference of 0.18%), Belgian (10.3%, a difference of 0.19%), and Egyptian (10.3%, a difference of 0.19%).
| Demographics | Rating | Rank | Male Poverty |
| Immigrants | Belgium | 96.8 /100 | #77 | Exceptional 10.3% |
| Irish | 96.8 /100 | #78 | Exceptional 10.3% |
| Immigrants | North America | 96.5 /100 | #79 | Exceptional 10.3% |
| English | 96.4 /100 | #80 | Exceptional 10.3% |
| Belgians | 95.9 /100 | #81 | Exceptional 10.3% |
| Egyptians | 95.9 /100 | #82 | Exceptional 10.3% |
| Immigrants | Sweden | 95.7 /100 | #83 | Exceptional 10.3% |
| Czechoslovakians | 95.6 /100 | #84 | Exceptional 10.3% |
| Immigrants | England | 95.5 /100 | #85 | Exceptional 10.4% |
| Immigrants | Eastern Asia | 95.3 /100 | #86 | Exceptional 10.4% |
| Northern Europeans | 95.2 /100 | #87 | Exceptional 10.4% |
| Cambodians | 95.0 /100 | #88 | Exceptional 10.4% |
| Immigrants | Denmark | 95.0 /100 | #89 | Exceptional 10.4% |
| Indians (Asian) | 94.9 /100 | #90 | Exceptional 10.4% |
| British | 94.8 /100 | #91 | Exceptional 10.4% |