Somali vs Alaskan Athabascan Male Poverty
COMPARE
Somali
Alaskan Athabascan
Male Poverty
Male Poverty Comparison
Somalis
Alaskan Athabascans
14.3%
MALE POVERTY
0.0/ 100
METRIC RATING
309th/ 347
METRIC RANK
12.8%
MALE POVERTY
0.3/ 100
METRIC RATING
243rd/ 347
METRIC RANK
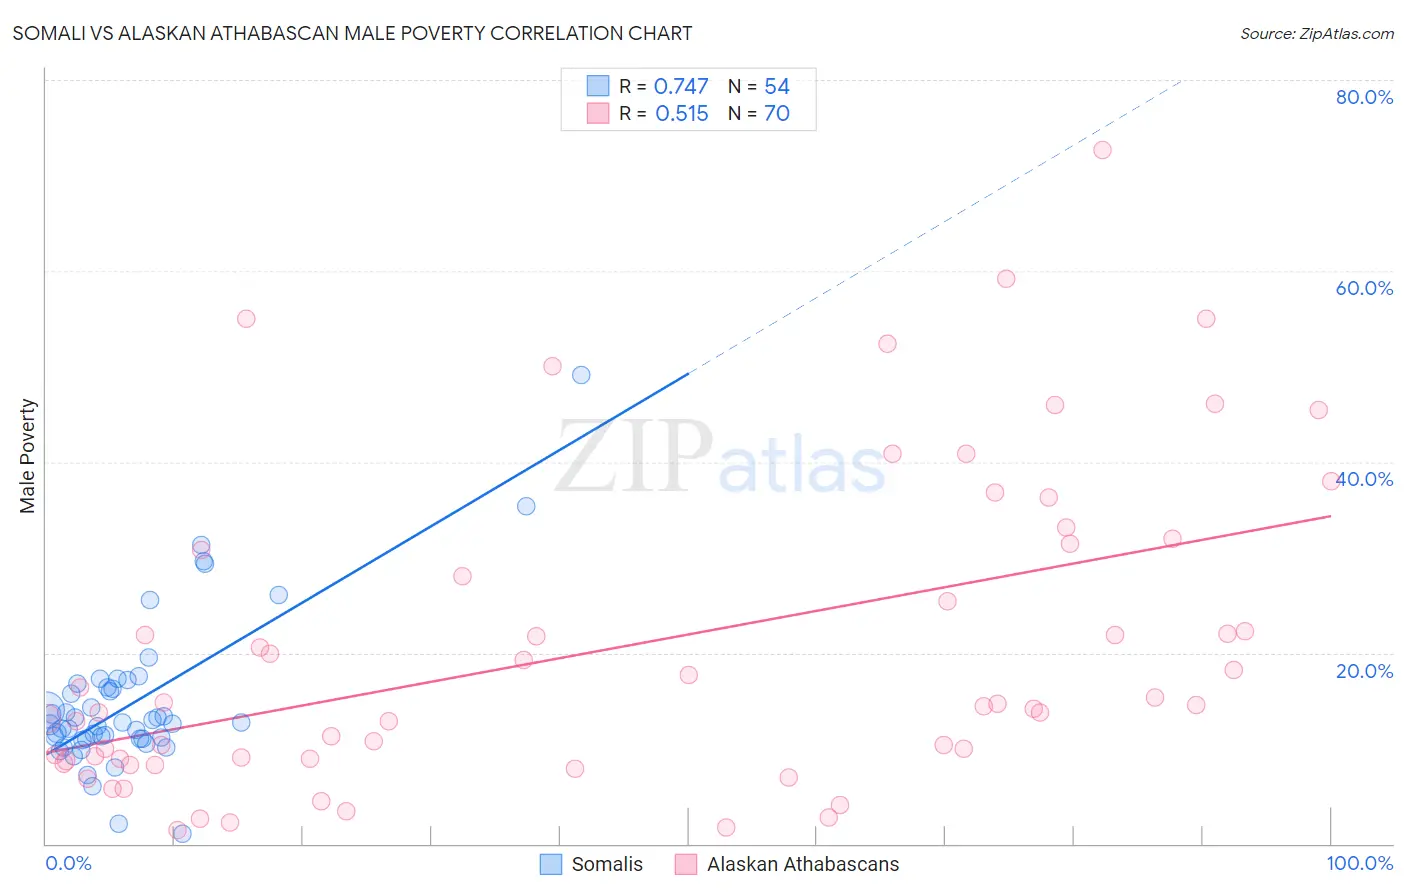
Somali vs Alaskan Athabascan Male Poverty Correlation Chart
The statistical analysis conducted on geographies consisting of 99,289,063 people shows a strong positive correlation between the proportion of Somalis and poverty level among males in the United States with a correlation coefficient (R) of 0.747 and weighted average of 14.3%. Similarly, the statistical analysis conducted on geographies consisting of 45,812,962 people shows a substantial positive correlation between the proportion of Alaskan Athabascans and poverty level among males in the United States with a correlation coefficient (R) of 0.515 and weighted average of 12.8%, a difference of 11.5%.
Male Poverty Correlation Summary
| Measurement | Somali | Alaskan Athabascan |
| Minimum | 1.0% | 1.4% |
| Maximum | 49.1% | 72.7% |
| Range | 48.1% | 71.3% |
| Mean | 14.8% | 20.4% |
| Median | 12.6% | 14.5% |
| Interquartile 25% (IQ1) | 10.9% | 8.9% |
| Interquartile 75% (IQ3) | 16.4% | 30.8% |
| Interquartile Range (IQR) | 5.4% | 22.0% |
| Standard Deviation (Sample) | 8.1% | 16.4% |
| Standard Deviation (Population) | 8.0% | 16.2% |
Similar Demographics by Male Poverty
Demographics Similar to Somalis by Male Poverty
In terms of male poverty, the demographic groups most similar to Somalis are Seminole (14.3%, a difference of 0.20%), African (14.2%, a difference of 0.38%), Dutch West Indian (14.2%, a difference of 0.40%), Honduran (14.3%, a difference of 0.41%), and Choctaw (14.4%, a difference of 0.88%).
| Demographics | Rating | Rank | Male Poverty |
| Immigrants | Caribbean | 0.0 /100 | #302 | Tragic 14.0% |
| Bahamians | 0.0 /100 | #303 | Tragic 14.1% |
| Senegalese | 0.0 /100 | #304 | Tragic 14.1% |
| Immigrants | Bangladesh | 0.0 /100 | #305 | Tragic 14.1% |
| Creek | 0.0 /100 | #306 | Tragic 14.1% |
| Dutch West Indians | 0.0 /100 | #307 | Tragic 14.2% |
| Africans | 0.0 /100 | #308 | Tragic 14.2% |
| Somalis | 0.0 /100 | #309 | Tragic 14.3% |
| Seminole | 0.0 /100 | #310 | Tragic 14.3% |
| Hondurans | 0.0 /100 | #311 | Tragic 14.3% |
| Choctaw | 0.0 /100 | #312 | Tragic 14.4% |
| Immigrants | Somalia | 0.0 /100 | #313 | Tragic 14.6% |
| Immigrants | Honduras | 0.0 /100 | #314 | Tragic 14.6% |
| Chippewa | 0.0 /100 | #315 | Tragic 14.6% |
| British West Indians | 0.0 /100 | #316 | Tragic 14.6% |
Demographics Similar to Alaskan Athabascans by Male Poverty
In terms of male poverty, the demographic groups most similar to Alaskan Athabascans are Nepalese (12.8%, a difference of 0.040%), Tsimshian (12.8%, a difference of 0.11%), Liberian (12.8%, a difference of 0.12%), Sudanese (12.8%, a difference of 0.20%), and Immigrants from El Salvador (12.8%, a difference of 0.42%).
| Demographics | Rating | Rank | Male Poverty |
| Immigrants | Saudi Arabia | 0.4 /100 | #236 | Tragic 12.7% |
| French American Indians | 0.4 /100 | #237 | Tragic 12.7% |
| Ecuadorians | 0.4 /100 | #238 | Tragic 12.7% |
| Ghanaians | 0.4 /100 | #239 | Tragic 12.7% |
| Immigrants | Middle Africa | 0.4 /100 | #240 | Tragic 12.7% |
| Sudanese | 0.3 /100 | #241 | Tragic 12.8% |
| Nepalese | 0.3 /100 | #242 | Tragic 12.8% |
| Alaskan Athabascans | 0.3 /100 | #243 | Tragic 12.8% |
| Tsimshian | 0.3 /100 | #244 | Tragic 12.8% |
| Liberians | 0.3 /100 | #245 | Tragic 12.8% |
| Immigrants | El Salvador | 0.2 /100 | #246 | Tragic 12.8% |
| Immigrants | Western Africa | 0.2 /100 | #247 | Tragic 12.9% |
| Immigrants | Sudan | 0.2 /100 | #248 | Tragic 12.9% |
| Potawatomi | 0.2 /100 | #249 | Tragic 12.9% |
| Immigrants | Nicaragua | 0.2 /100 | #250 | Tragic 12.9% |