Scotch-Irish vs Ghanaian Single Female Poverty
COMPARE
Scotch-Irish
Ghanaian
Single Female Poverty
Single Female Poverty Comparison
Scotch-Irish
Ghanaians
22.9%
SINGLE FEMALE POVERTY
0.3/ 100
METRIC RATING
263rd/ 347
METRIC RANK
21.6%
SINGLE FEMALE POVERTY
15.7/ 100
METRIC RATING
207th/ 347
METRIC RANK
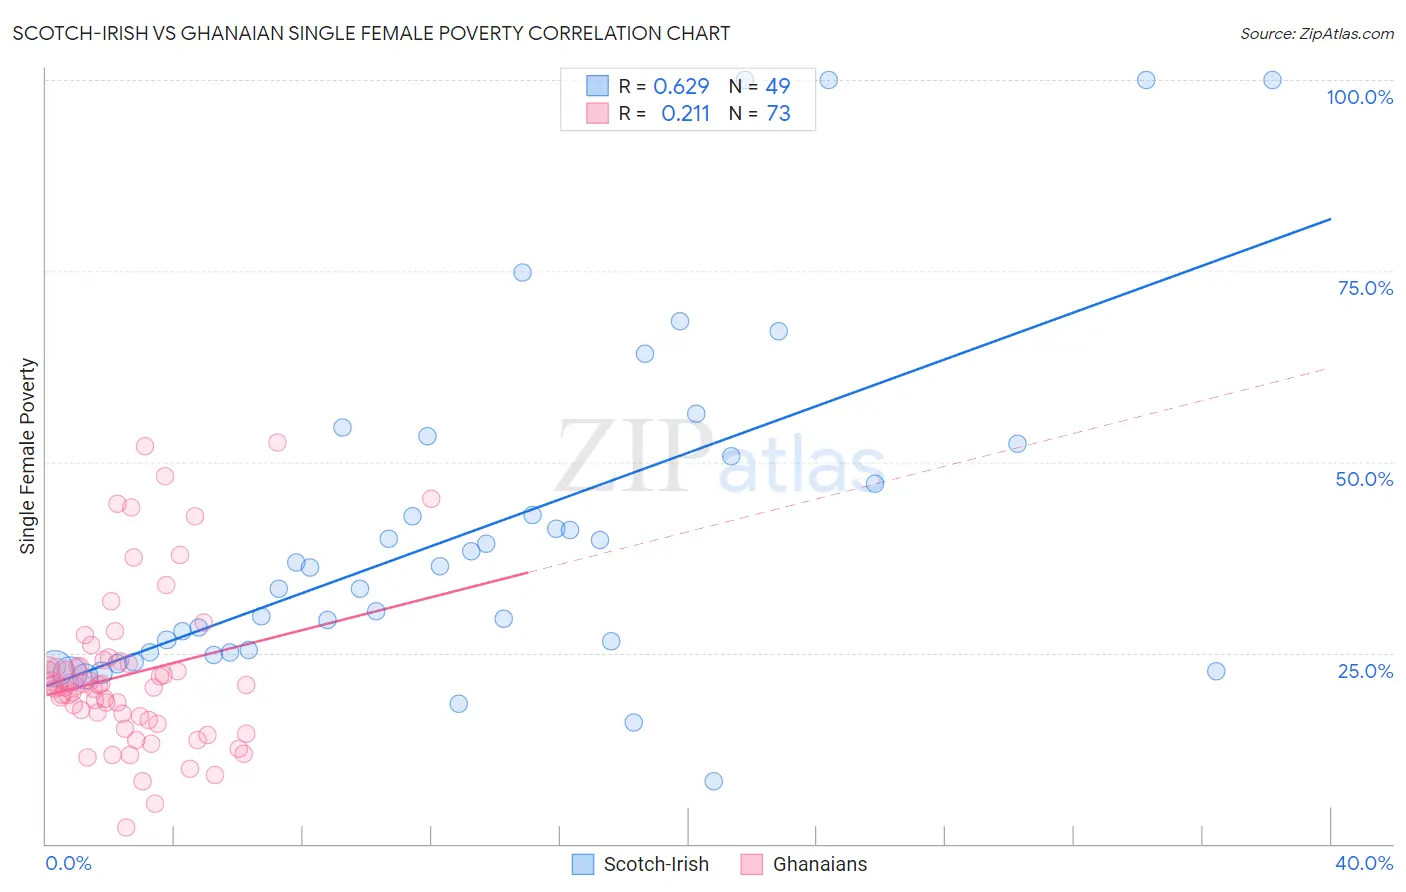
Scotch-Irish vs Ghanaian Single Female Poverty Correlation Chart
The statistical analysis conducted on geographies consisting of 531,342,644 people shows a significant positive correlation between the proportion of Scotch-Irish and poverty level among single females in the United States with a correlation coefficient (R) of 0.629 and weighted average of 22.9%. Similarly, the statistical analysis conducted on geographies consisting of 189,278,551 people shows a weak positive correlation between the proportion of Ghanaians and poverty level among single females in the United States with a correlation coefficient (R) of 0.211 and weighted average of 21.6%, a difference of 6.4%.
Single Female Poverty Correlation Summary
| Measurement | Scotch-Irish | Ghanaian |
| Minimum | 8.1% | 2.1% |
| Maximum | 100.0% | 52.6% |
| Range | 91.9% | 50.5% |
| Mean | 41.2% | 22.2% |
| Median | 36.1% | 20.7% |
| Interquartile 25% (IQ1) | 25.0% | 16.5% |
| Interquartile 75% (IQ3) | 51.6% | 23.7% |
| Interquartile Range (IQR) | 26.6% | 7.2% |
| Standard Deviation (Sample) | 22.8% | 10.4% |
| Standard Deviation (Population) | 22.5% | 10.3% |
Similar Demographics by Single Female Poverty
Demographics Similar to Scotch-Irish by Single Female Poverty
In terms of single female poverty, the demographic groups most similar to Scotch-Irish are Immigrants from Laos (22.9%, a difference of 0.070%), Central American (23.0%, a difference of 0.24%), British West Indian (22.8%, a difference of 0.41%), Immigrants from Micronesia (23.0%, a difference of 0.45%), and Senegalese (23.0%, a difference of 0.51%).
| Demographics | Rating | Rank | Single Female Poverty |
| Immigrants | Belize | 0.8 /100 | #256 | Tragic 22.6% |
| Sudanese | 0.7 /100 | #257 | Tragic 22.6% |
| Bahamians | 0.6 /100 | #258 | Tragic 22.7% |
| Whites/Caucasians | 0.6 /100 | #259 | Tragic 22.7% |
| Celtics | 0.5 /100 | #260 | Tragic 22.7% |
| Immigrants | Cabo Verde | 0.4 /100 | #261 | Tragic 22.8% |
| British West Indians | 0.4 /100 | #262 | Tragic 22.8% |
| Scotch-Irish | 0.3 /100 | #263 | Tragic 22.9% |
| Immigrants | Laos | 0.3 /100 | #264 | Tragic 22.9% |
| Central Americans | 0.2 /100 | #265 | Tragic 23.0% |
| Immigrants | Micronesia | 0.2 /100 | #266 | Tragic 23.0% |
| Senegalese | 0.2 /100 | #267 | Tragic 23.0% |
| Fijians | 0.2 /100 | #268 | Tragic 23.1% |
| Hmong | 0.2 /100 | #269 | Tragic 23.1% |
| Inupiat | 0.2 /100 | #270 | Tragic 23.1% |
Demographics Similar to Ghanaians by Single Female Poverty
In terms of single female poverty, the demographic groups most similar to Ghanaians are Belgian (21.5%, a difference of 0.040%), Haitian (21.6%, a difference of 0.040%), Finnish (21.5%, a difference of 0.050%), Immigrants from Eastern Africa (21.6%, a difference of 0.070%), and Immigrants from Africa (21.5%, a difference of 0.11%).
| Demographics | Rating | Rank | Single Female Poverty |
| Irish | 21.4 /100 | #200 | Fair 21.4% |
| Nigerians | 20.9 /100 | #201 | Fair 21.4% |
| Immigrants | Kenya | 20.7 /100 | #202 | Fair 21.4% |
| Immigrants | Haiti | 18.8 /100 | #203 | Poor 21.5% |
| Immigrants | Africa | 16.7 /100 | #204 | Poor 21.5% |
| Finns | 16.2 /100 | #205 | Poor 21.5% |
| Belgians | 16.1 /100 | #206 | Poor 21.5% |
| Ghanaians | 15.7 /100 | #207 | Poor 21.6% |
| Haitians | 15.4 /100 | #208 | Poor 21.6% |
| Immigrants | Eastern Africa | 15.1 /100 | #209 | Poor 21.6% |
| Immigrants | Panama | 14.4 /100 | #210 | Poor 21.6% |
| Icelanders | 14.0 /100 | #211 | Poor 21.6% |
| Jamaicans | 14.0 /100 | #212 | Poor 21.6% |
| Guamanians/Chamorros | 13.7 /100 | #213 | Poor 21.6% |
| Immigrants | Nicaragua | 13.3 /100 | #214 | Poor 21.6% |