Scotch-Irish vs Seminole Single Female Poverty
COMPARE
Scotch-Irish
Seminole
Single Female Poverty
Single Female Poverty Comparison
Scotch-Irish
Seminole
22.9%
SINGLE FEMALE POVERTY
0.3/ 100
METRIC RATING
263rd/ 347
METRIC RANK
26.8%
SINGLE FEMALE POVERTY
0.0/ 100
METRIC RATING
322nd/ 347
METRIC RANK
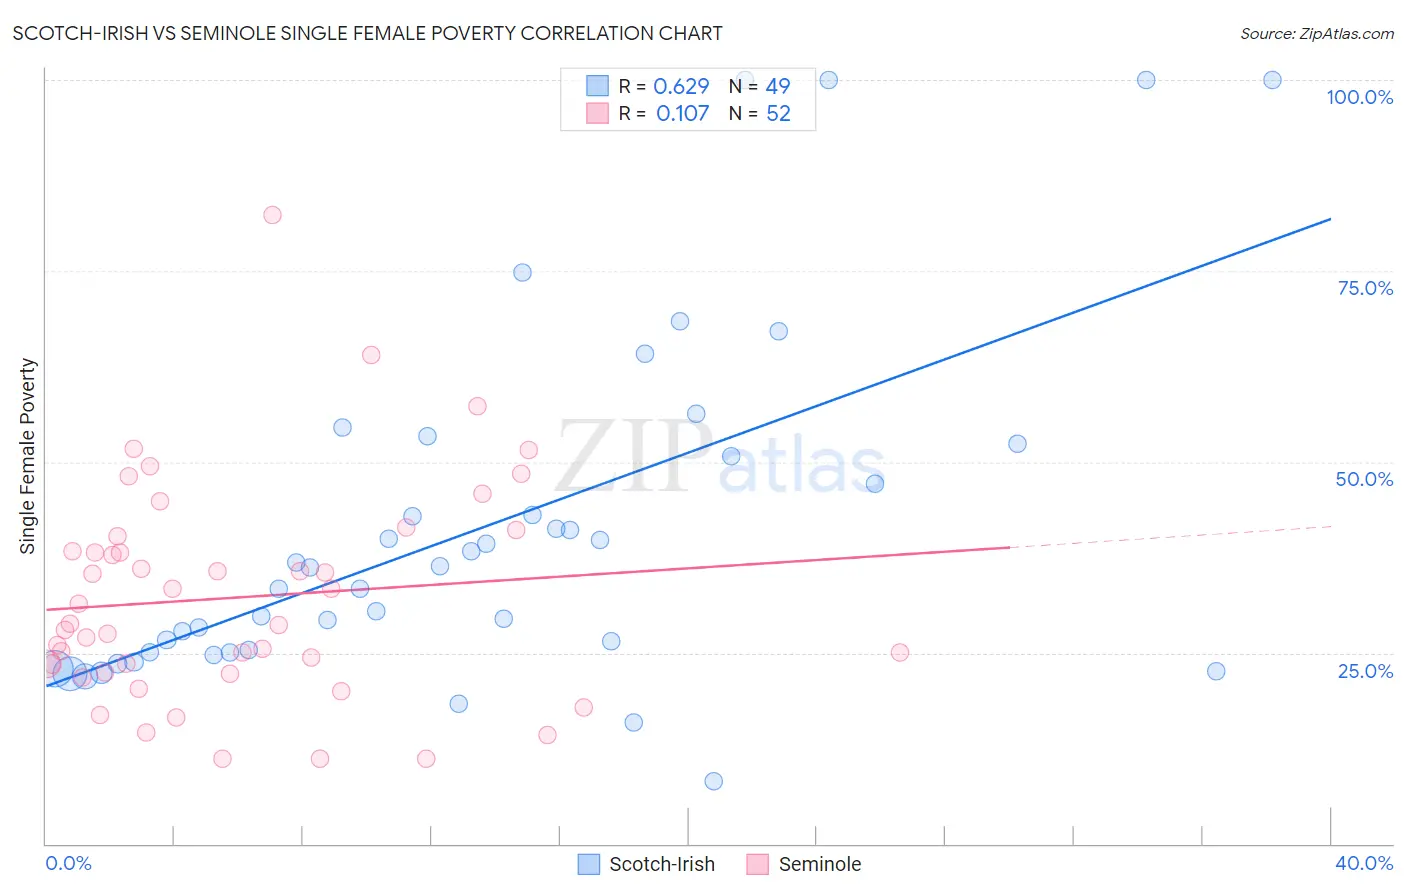
Scotch-Irish vs Seminole Single Female Poverty Correlation Chart
The statistical analysis conducted on geographies consisting of 531,342,644 people shows a significant positive correlation between the proportion of Scotch-Irish and poverty level among single females in the United States with a correlation coefficient (R) of 0.629 and weighted average of 22.9%. Similarly, the statistical analysis conducted on geographies consisting of 117,983,009 people shows a poor positive correlation between the proportion of Seminole and poverty level among single females in the United States with a correlation coefficient (R) of 0.107 and weighted average of 26.8%, a difference of 16.9%.
Single Female Poverty Correlation Summary
| Measurement | Scotch-Irish | Seminole |
| Minimum | 8.1% | 11.1% |
| Maximum | 100.0% | 82.4% |
| Range | 91.9% | 71.2% |
| Mean | 41.2% | 32.3% |
| Median | 36.1% | 28.7% |
| Interquartile 25% (IQ1) | 25.0% | 23.0% |
| Interquartile 75% (IQ3) | 51.6% | 39.2% |
| Interquartile Range (IQR) | 26.6% | 16.2% |
| Standard Deviation (Sample) | 22.8% | 14.2% |
| Standard Deviation (Population) | 22.5% | 14.1% |
Similar Demographics by Single Female Poverty
Demographics Similar to Scotch-Irish by Single Female Poverty
In terms of single female poverty, the demographic groups most similar to Scotch-Irish are Immigrants from Laos (22.9%, a difference of 0.070%), Central American (23.0%, a difference of 0.24%), British West Indian (22.8%, a difference of 0.41%), Immigrants from Micronesia (23.0%, a difference of 0.45%), and Senegalese (23.0%, a difference of 0.51%).
| Demographics | Rating | Rank | Single Female Poverty |
| Immigrants | Belize | 0.8 /100 | #256 | Tragic 22.6% |
| Sudanese | 0.7 /100 | #257 | Tragic 22.6% |
| Bahamians | 0.6 /100 | #258 | Tragic 22.7% |
| Whites/Caucasians | 0.6 /100 | #259 | Tragic 22.7% |
| Celtics | 0.5 /100 | #260 | Tragic 22.7% |
| Immigrants | Cabo Verde | 0.4 /100 | #261 | Tragic 22.8% |
| British West Indians | 0.4 /100 | #262 | Tragic 22.8% |
| Scotch-Irish | 0.3 /100 | #263 | Tragic 22.9% |
| Immigrants | Laos | 0.3 /100 | #264 | Tragic 22.9% |
| Central Americans | 0.2 /100 | #265 | Tragic 23.0% |
| Immigrants | Micronesia | 0.2 /100 | #266 | Tragic 23.0% |
| Senegalese | 0.2 /100 | #267 | Tragic 23.0% |
| Fijians | 0.2 /100 | #268 | Tragic 23.1% |
| Hmong | 0.2 /100 | #269 | Tragic 23.1% |
| Inupiat | 0.2 /100 | #270 | Tragic 23.1% |
Demographics Similar to Seminole by Single Female Poverty
In terms of single female poverty, the demographic groups most similar to Seminole are Chippewa (26.8%, a difference of 0.10%), Kiowa (26.9%, a difference of 0.52%), Yup'ik (26.6%, a difference of 0.74%), Arapaho (26.4%, a difference of 1.4%), and Choctaw (27.2%, a difference of 1.5%).
| Demographics | Rating | Rank | Single Female Poverty |
| Iroquois | 0.0 /100 | #315 | Tragic 25.7% |
| Immigrants | Somalia | 0.0 /100 | #316 | Tragic 25.8% |
| Ottawa | 0.0 /100 | #317 | Tragic 26.0% |
| Chickasaw | 0.0 /100 | #318 | Tragic 26.3% |
| Blacks/African Americans | 0.0 /100 | #319 | Tragic 26.4% |
| Arapaho | 0.0 /100 | #320 | Tragic 26.4% |
| Yup'ik | 0.0 /100 | #321 | Tragic 26.6% |
| Seminole | 0.0 /100 | #322 | Tragic 26.8% |
| Chippewa | 0.0 /100 | #323 | Tragic 26.8% |
| Kiowa | 0.0 /100 | #324 | Tragic 26.9% |
| Choctaw | 0.0 /100 | #325 | Tragic 27.2% |
| Creek | 0.0 /100 | #326 | Tragic 27.4% |
| Dutch West Indians | 0.0 /100 | #327 | Tragic 27.5% |
| Apache | 0.0 /100 | #328 | Tragic 27.7% |
| Menominee | 0.0 /100 | #329 | Tragic 27.8% |