Bulgarian vs Ghanaian Single Female Poverty
COMPARE
Bulgarian
Ghanaian
Single Female Poverty
Single Female Poverty Comparison
Bulgarians
Ghanaians
18.8%
SINGLE FEMALE POVERTY
99.9/ 100
METRIC RATING
39th/ 347
METRIC RANK
21.6%
SINGLE FEMALE POVERTY
15.7/ 100
METRIC RATING
207th/ 347
METRIC RANK
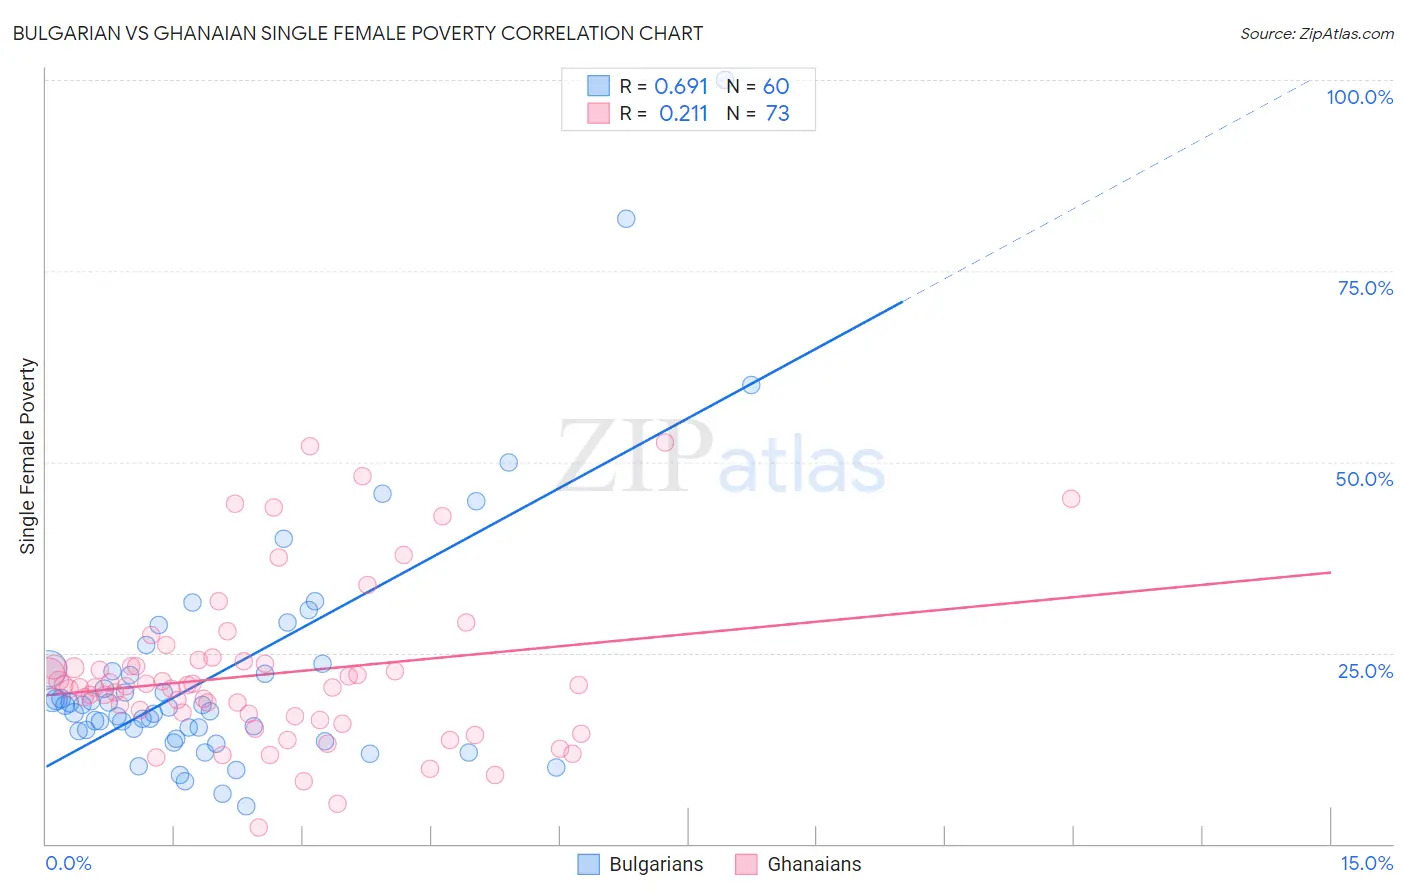
Bulgarian vs Ghanaian Single Female Poverty Correlation Chart
The statistical analysis conducted on geographies consisting of 203,529,625 people shows a significant positive correlation between the proportion of Bulgarians and poverty level among single females in the United States with a correlation coefficient (R) of 0.691 and weighted average of 18.8%. Similarly, the statistical analysis conducted on geographies consisting of 189,278,551 people shows a weak positive correlation between the proportion of Ghanaians and poverty level among single females in the United States with a correlation coefficient (R) of 0.211 and weighted average of 21.6%, a difference of 14.7%.
Single Female Poverty Correlation Summary
| Measurement | Bulgarian | Ghanaian |
| Minimum | 5.0% | 2.1% |
| Maximum | 100.0% | 52.6% |
| Range | 95.0% | 50.5% |
| Mean | 22.4% | 22.2% |
| Median | 18.0% | 20.7% |
| Interquartile 25% (IQ1) | 14.8% | 16.5% |
| Interquartile 75% (IQ3) | 22.7% | 23.7% |
| Interquartile Range (IQR) | 7.9% | 7.2% |
| Standard Deviation (Sample) | 16.6% | 10.4% |
| Standard Deviation (Population) | 16.5% | 10.3% |
Similar Demographics by Single Female Poverty
Demographics Similar to Bulgarians by Single Female Poverty
In terms of single female poverty, the demographic groups most similar to Bulgarians are Tongan (18.8%, a difference of 0.030%), Okinawan (18.8%, a difference of 0.030%), Immigrants from Serbia (18.8%, a difference of 0.050%), Jordanian (18.8%, a difference of 0.13%), and Immigrants from Romania (18.8%, a difference of 0.28%).
| Demographics | Rating | Rank | Single Female Poverty |
| Immigrants | Sri Lanka | 99.9 /100 | #32 | Exceptional 18.6% |
| Immigrants | Philippines | 99.9 /100 | #33 | Exceptional 18.6% |
| Koreans | 99.9 /100 | #34 | Exceptional 18.6% |
| Immigrants | Japan | 99.9 /100 | #35 | Exceptional 18.6% |
| Turks | 99.9 /100 | #36 | Exceptional 18.7% |
| Immigrants | Armenia | 99.9 /100 | #37 | Exceptional 18.7% |
| Tongans | 99.9 /100 | #38 | Exceptional 18.8% |
| Bulgarians | 99.9 /100 | #39 | Exceptional 18.8% |
| Okinawans | 99.9 /100 | #40 | Exceptional 18.8% |
| Immigrants | Serbia | 99.9 /100 | #41 | Exceptional 18.8% |
| Jordanians | 99.9 /100 | #42 | Exceptional 18.8% |
| Immigrants | Romania | 99.9 /100 | #43 | Exceptional 18.8% |
| Immigrants | Croatia | 99.9 /100 | #44 | Exceptional 18.9% |
| Immigrants | Indonesia | 99.8 /100 | #45 | Exceptional 18.9% |
| Macedonians | 99.8 /100 | #46 | Exceptional 18.9% |
Demographics Similar to Ghanaians by Single Female Poverty
In terms of single female poverty, the demographic groups most similar to Ghanaians are Belgian (21.5%, a difference of 0.040%), Haitian (21.6%, a difference of 0.040%), Finnish (21.5%, a difference of 0.050%), Immigrants from Eastern Africa (21.6%, a difference of 0.070%), and Immigrants from Africa (21.5%, a difference of 0.11%).
| Demographics | Rating | Rank | Single Female Poverty |
| Irish | 21.4 /100 | #200 | Fair 21.4% |
| Nigerians | 20.9 /100 | #201 | Fair 21.4% |
| Immigrants | Kenya | 20.7 /100 | #202 | Fair 21.4% |
| Immigrants | Haiti | 18.8 /100 | #203 | Poor 21.5% |
| Immigrants | Africa | 16.7 /100 | #204 | Poor 21.5% |
| Finns | 16.2 /100 | #205 | Poor 21.5% |
| Belgians | 16.1 /100 | #206 | Poor 21.5% |
| Ghanaians | 15.7 /100 | #207 | Poor 21.6% |
| Haitians | 15.4 /100 | #208 | Poor 21.6% |
| Immigrants | Eastern Africa | 15.1 /100 | #209 | Poor 21.6% |
| Immigrants | Panama | 14.4 /100 | #210 | Poor 21.6% |
| Icelanders | 14.0 /100 | #211 | Poor 21.6% |
| Jamaicans | 14.0 /100 | #212 | Poor 21.6% |
| Guamanians/Chamorros | 13.7 /100 | #213 | Poor 21.6% |
| Immigrants | Nicaragua | 13.3 /100 | #214 | Poor 21.6% |