Scotch-Irish vs Bermudan Single Female Poverty
COMPARE
Scotch-Irish
Bermudan
Single Female Poverty
Single Female Poverty Comparison
Scotch-Irish
Bermudans
22.9%
SINGLE FEMALE POVERTY
0.3/ 100
METRIC RATING
263rd/ 347
METRIC RANK
22.3%
SINGLE FEMALE POVERTY
2.0/ 100
METRIC RATING
242nd/ 347
METRIC RANK
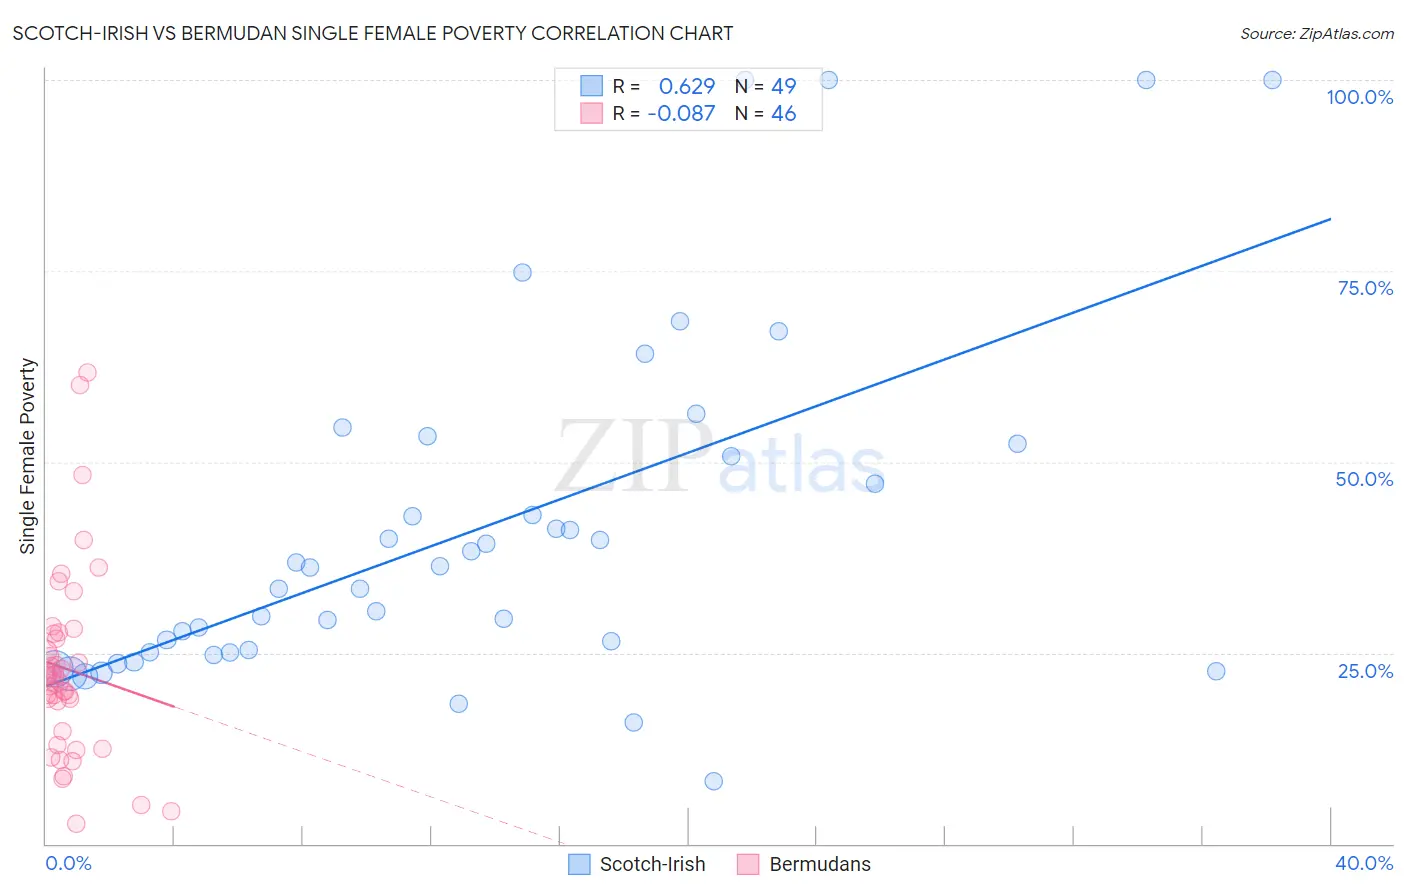
Scotch-Irish vs Bermudan Single Female Poverty Correlation Chart
The statistical analysis conducted on geographies consisting of 531,342,644 people shows a significant positive correlation between the proportion of Scotch-Irish and poverty level among single females in the United States with a correlation coefficient (R) of 0.629 and weighted average of 22.9%. Similarly, the statistical analysis conducted on geographies consisting of 55,621,982 people shows a slight negative correlation between the proportion of Bermudans and poverty level among single females in the United States with a correlation coefficient (R) of -0.087 and weighted average of 22.3%, a difference of 2.9%.
Single Female Poverty Correlation Summary
| Measurement | Scotch-Irish | Bermudan |
| Minimum | 8.1% | 2.6% |
| Maximum | 100.0% | 61.7% |
| Range | 91.9% | 59.1% |
| Mean | 41.2% | 22.9% |
| Median | 36.1% | 21.5% |
| Interquartile 25% (IQ1) | 25.0% | 14.8% |
| Interquartile 75% (IQ3) | 51.6% | 27.4% |
| Interquartile Range (IQR) | 26.6% | 12.7% |
| Standard Deviation (Sample) | 22.8% | 12.4% |
| Standard Deviation (Population) | 22.5% | 12.3% |
Similar Demographics by Single Female Poverty
Demographics Similar to Scotch-Irish by Single Female Poverty
In terms of single female poverty, the demographic groups most similar to Scotch-Irish are Immigrants from Laos (22.9%, a difference of 0.070%), Central American (23.0%, a difference of 0.24%), British West Indian (22.8%, a difference of 0.41%), Immigrants from Micronesia (23.0%, a difference of 0.45%), and Senegalese (23.0%, a difference of 0.51%).
| Demographics | Rating | Rank | Single Female Poverty |
| Immigrants | Belize | 0.8 /100 | #256 | Tragic 22.6% |
| Sudanese | 0.7 /100 | #257 | Tragic 22.6% |
| Bahamians | 0.6 /100 | #258 | Tragic 22.7% |
| Whites/Caucasians | 0.6 /100 | #259 | Tragic 22.7% |
| Celtics | 0.5 /100 | #260 | Tragic 22.7% |
| Immigrants | Cabo Verde | 0.4 /100 | #261 | Tragic 22.8% |
| British West Indians | 0.4 /100 | #262 | Tragic 22.8% |
| Scotch-Irish | 0.3 /100 | #263 | Tragic 22.9% |
| Immigrants | Laos | 0.3 /100 | #264 | Tragic 22.9% |
| Central Americans | 0.2 /100 | #265 | Tragic 23.0% |
| Immigrants | Micronesia | 0.2 /100 | #266 | Tragic 23.0% |
| Senegalese | 0.2 /100 | #267 | Tragic 23.0% |
| Fijians | 0.2 /100 | #268 | Tragic 23.1% |
| Hmong | 0.2 /100 | #269 | Tragic 23.1% |
| Inupiat | 0.2 /100 | #270 | Tragic 23.1% |
Demographics Similar to Bermudans by Single Female Poverty
In terms of single female poverty, the demographic groups most similar to Bermudans are Cape Verdean (22.3%, a difference of 0.070%), West Indian (22.3%, a difference of 0.090%), Immigrants from Middle Africa (22.3%, a difference of 0.10%), Immigrants from Bangladesh (22.3%, a difference of 0.14%), and French (22.2%, a difference of 0.21%).
| Demographics | Rating | Rank | Single Female Poverty |
| Dutch | 4.6 /100 | #235 | Tragic 22.0% |
| Immigrants | Ecuador | 4.2 /100 | #236 | Tragic 22.0% |
| Vietnamese | 4.0 /100 | #237 | Tragic 22.0% |
| French Canadians | 2.8 /100 | #238 | Tragic 22.2% |
| Malaysians | 2.8 /100 | #239 | Tragic 22.2% |
| French | 2.3 /100 | #240 | Tragic 22.2% |
| Cape Verdeans | 2.1 /100 | #241 | Tragic 22.3% |
| Bermudans | 2.0 /100 | #242 | Tragic 22.3% |
| West Indians | 1.9 /100 | #243 | Tragic 22.3% |
| Immigrants | Middle Africa | 1.9 /100 | #244 | Tragic 22.3% |
| Immigrants | Bangladesh | 1.8 /100 | #245 | Tragic 22.3% |
| Liberians | 1.4 /100 | #246 | Tragic 22.4% |
| Immigrants | El Salvador | 1.4 /100 | #247 | Tragic 22.4% |
| Belizeans | 1.4 /100 | #248 | Tragic 22.4% |
| Immigrants | Caribbean | 1.3 /100 | #249 | Tragic 22.4% |