Scotch-Irish vs Immigrants from Malaysia Single Female Poverty
COMPARE
Scotch-Irish
Immigrants from Malaysia
Single Female Poverty
Single Female Poverty Comparison
Scotch-Irish
Immigrants from Malaysia
22.9%
SINGLE FEMALE POVERTY
0.3/ 100
METRIC RATING
263rd/ 347
METRIC RANK
19.4%
SINGLE FEMALE POVERTY
99.2/ 100
METRIC RATING
82nd/ 347
METRIC RANK
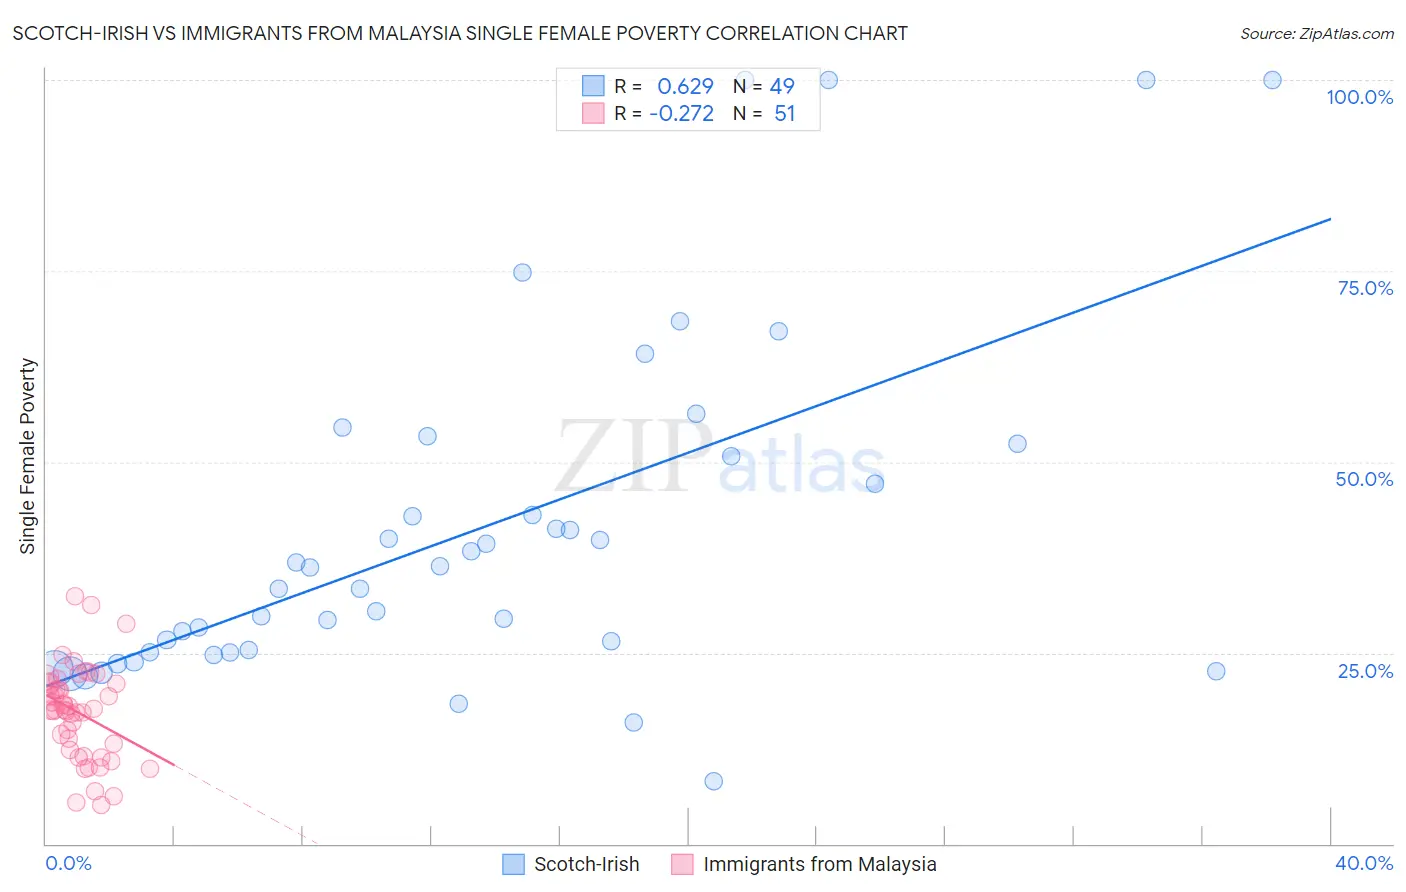
Scotch-Irish vs Immigrants from Malaysia Single Female Poverty Correlation Chart
The statistical analysis conducted on geographies consisting of 531,342,644 people shows a significant positive correlation between the proportion of Scotch-Irish and poverty level among single females in the United States with a correlation coefficient (R) of 0.629 and weighted average of 22.9%. Similarly, the statistical analysis conducted on geographies consisting of 196,207,874 people shows a weak negative correlation between the proportion of Immigrants from Malaysia and poverty level among single females in the United States with a correlation coefficient (R) of -0.272 and weighted average of 19.4%, a difference of 18.1%.
Single Female Poverty Correlation Summary
| Measurement | Scotch-Irish | Immigrants from Malaysia |
| Minimum | 8.1% | 5.0% |
| Maximum | 100.0% | 32.5% |
| Range | 91.9% | 27.5% |
| Mean | 41.2% | 17.2% |
| Median | 36.1% | 17.6% |
| Interquartile 25% (IQ1) | 25.0% | 12.3% |
| Interquartile 75% (IQ3) | 51.6% | 20.9% |
| Interquartile Range (IQR) | 26.6% | 8.6% |
| Standard Deviation (Sample) | 22.8% | 6.1% |
| Standard Deviation (Population) | 22.5% | 6.0% |
Similar Demographics by Single Female Poverty
Demographics Similar to Scotch-Irish by Single Female Poverty
In terms of single female poverty, the demographic groups most similar to Scotch-Irish are Immigrants from Laos (22.9%, a difference of 0.070%), Central American (23.0%, a difference of 0.24%), British West Indian (22.8%, a difference of 0.41%), Immigrants from Micronesia (23.0%, a difference of 0.45%), and Senegalese (23.0%, a difference of 0.51%).
| Demographics | Rating | Rank | Single Female Poverty |
| Immigrants | Belize | 0.8 /100 | #256 | Tragic 22.6% |
| Sudanese | 0.7 /100 | #257 | Tragic 22.6% |
| Bahamians | 0.6 /100 | #258 | Tragic 22.7% |
| Whites/Caucasians | 0.6 /100 | #259 | Tragic 22.7% |
| Celtics | 0.5 /100 | #260 | Tragic 22.7% |
| Immigrants | Cabo Verde | 0.4 /100 | #261 | Tragic 22.8% |
| British West Indians | 0.4 /100 | #262 | Tragic 22.8% |
| Scotch-Irish | 0.3 /100 | #263 | Tragic 22.9% |
| Immigrants | Laos | 0.3 /100 | #264 | Tragic 22.9% |
| Central Americans | 0.2 /100 | #265 | Tragic 23.0% |
| Immigrants | Micronesia | 0.2 /100 | #266 | Tragic 23.0% |
| Senegalese | 0.2 /100 | #267 | Tragic 23.0% |
| Fijians | 0.2 /100 | #268 | Tragic 23.1% |
| Hmong | 0.2 /100 | #269 | Tragic 23.1% |
| Inupiat | 0.2 /100 | #270 | Tragic 23.1% |
Demographics Similar to Immigrants from Malaysia by Single Female Poverty
In terms of single female poverty, the demographic groups most similar to Immigrants from Malaysia are Immigrants from Scotland (19.4%, a difference of 0.010%), Taiwanese (19.4%, a difference of 0.010%), Immigrants from Australia (19.4%, a difference of 0.030%), Immigrants from Sierra Leone (19.4%, a difference of 0.070%), and Albanian (19.4%, a difference of 0.090%).
| Demographics | Rating | Rank | Single Female Poverty |
| Immigrants | Turkey | 99.4 /100 | #75 | Exceptional 19.4% |
| Peruvians | 99.4 /100 | #76 | Exceptional 19.4% |
| Immigrants | Russia | 99.3 /100 | #77 | Exceptional 19.4% |
| Albanians | 99.3 /100 | #78 | Exceptional 19.4% |
| Immigrants | Sierra Leone | 99.3 /100 | #79 | Exceptional 19.4% |
| Immigrants | Australia | 99.3 /100 | #80 | Exceptional 19.4% |
| Immigrants | Scotland | 99.2 /100 | #81 | Exceptional 19.4% |
| Immigrants | Malaysia | 99.2 /100 | #82 | Exceptional 19.4% |
| Taiwanese | 99.2 /100 | #83 | Exceptional 19.4% |
| Immigrants | Sweden | 99.2 /100 | #84 | Exceptional 19.4% |
| Immigrants | Albania | 99.2 /100 | #85 | Exceptional 19.4% |
| Greeks | 99.2 /100 | #86 | Exceptional 19.4% |
| Zimbabweans | 99.0 /100 | #87 | Exceptional 19.5% |
| Afghans | 99.0 /100 | #88 | Exceptional 19.5% |
| Immigrants | Ukraine | 99.0 /100 | #89 | Exceptional 19.5% |