Scotch-Irish vs Ghanaian Unemployment Among Seniors over 65 years
COMPARE
Scotch-Irish
Ghanaian
Unemployment Among Seniors over 65 years
Unemployment Among Seniors over 65 years Comparison
Scotch-Irish
Ghanaians
4.9%
UNEMPLOYMENT AMONG SENIORS OVER 65 YEARS
99.9/ 100
METRIC RATING
51st/ 347
METRIC RANK
5.4%
UNEMPLOYMENT AMONG SENIORS OVER 65 YEARS
0.6/ 100
METRIC RATING
250th/ 347
METRIC RANK
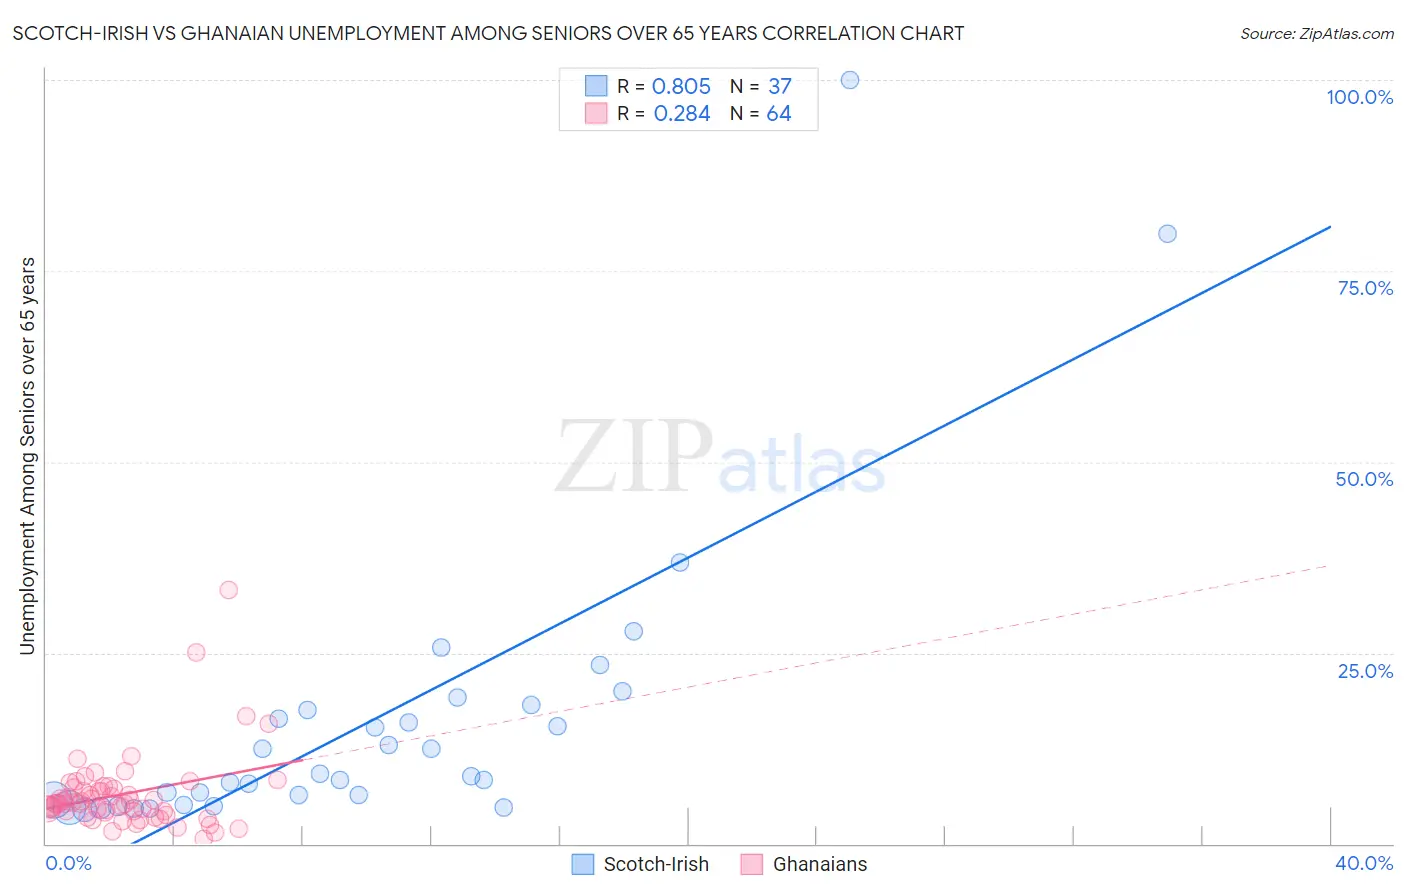
Scotch-Irish vs Ghanaian Unemployment Among Seniors over 65 years Correlation Chart
The statistical analysis conducted on geographies consisting of 447,057,926 people shows a very strong positive correlation between the proportion of Scotch-Irish and unemployment rate amomg seniors over the age of 65 in the United States with a correlation coefficient (R) of 0.805 and weighted average of 4.9%. Similarly, the statistical analysis conducted on geographies consisting of 181,103,257 people shows a weak positive correlation between the proportion of Ghanaians and unemployment rate amomg seniors over the age of 65 in the United States with a correlation coefficient (R) of 0.284 and weighted average of 5.4%, a difference of 9.8%.
Unemployment Among Seniors over 65 years Correlation Summary
| Measurement | Scotch-Irish | Ghanaian |
| Minimum | 4.4% | 0.70% |
| Maximum | 100.0% | 33.3% |
| Range | 95.6% | 32.6% |
| Mean | 16.1% | 6.5% |
| Median | 8.9% | 5.2% |
| Interquartile 25% (IQ1) | 5.4% | 4.2% |
| Interquartile 75% (IQ3) | 17.8% | 7.3% |
| Interquartile Range (IQR) | 12.3% | 3.1% |
| Standard Deviation (Sample) | 19.6% | 5.1% |
| Standard Deviation (Population) | 19.4% | 5.0% |
Similar Demographics by Unemployment Among Seniors over 65 years
Demographics Similar to Scotch-Irish by Unemployment Among Seniors over 65 years
In terms of unemployment among seniors over 65 years, the demographic groups most similar to Scotch-Irish are Swedish (4.9%, a difference of 0.020%), Immigrants from Sudan (4.9%, a difference of 0.060%), Immigrants from Austria (4.9%, a difference of 0.12%), Immigrants from Iraq (4.9%, a difference of 0.12%), and Immigrants from Kenya (4.9%, a difference of 0.13%).
| Demographics | Rating | Rank | Unemployment Among Seniors over 65 years |
| Jordanians | 99.9 /100 | #44 | Exceptional 4.9% |
| Ethiopians | 99.9 /100 | #45 | Exceptional 4.9% |
| Immigrants | Jordan | 99.9 /100 | #46 | Exceptional 4.9% |
| Germans | 99.9 /100 | #47 | Exceptional 4.9% |
| Choctaw | 99.9 /100 | #48 | Exceptional 4.9% |
| Immigrants | Kenya | 99.9 /100 | #49 | Exceptional 4.9% |
| Immigrants | Austria | 99.9 /100 | #50 | Exceptional 4.9% |
| Scotch-Irish | 99.9 /100 | #51 | Exceptional 4.9% |
| Swedes | 99.9 /100 | #52 | Exceptional 4.9% |
| Immigrants | Sudan | 99.8 /100 | #53 | Exceptional 4.9% |
| Immigrants | Iraq | 99.8 /100 | #54 | Exceptional 4.9% |
| Europeans | 99.8 /100 | #55 | Exceptional 4.9% |
| Carpatho Rusyns | 99.8 /100 | #56 | Exceptional 4.9% |
| Danes | 99.8 /100 | #57 | Exceptional 4.9% |
| Scandinavians | 99.8 /100 | #58 | Exceptional 4.9% |
Demographics Similar to Ghanaians by Unemployment Among Seniors over 65 years
In terms of unemployment among seniors over 65 years, the demographic groups most similar to Ghanaians are Immigrants (5.4%, a difference of 0.0%), West Indian (5.4%, a difference of 0.010%), French Canadian (5.4%, a difference of 0.030%), Immigrants from Caribbean (5.3%, a difference of 0.080%), and Trinidadian and Tobagonian (5.4%, a difference of 0.080%).
| Demographics | Rating | Rank | Unemployment Among Seniors over 65 years |
| Nigerians | 0.9 /100 | #243 | Tragic 5.3% |
| Peruvians | 0.8 /100 | #244 | Tragic 5.3% |
| Ottawa | 0.8 /100 | #245 | Tragic 5.3% |
| Colombians | 0.7 /100 | #246 | Tragic 5.3% |
| Immigrants | Caribbean | 0.7 /100 | #247 | Tragic 5.3% |
| French Canadians | 0.7 /100 | #248 | Tragic 5.4% |
| Immigrants | Immigrants | 0.6 /100 | #249 | Tragic 5.4% |
| Ghanaians | 0.6 /100 | #250 | Tragic 5.4% |
| West Indians | 0.6 /100 | #251 | Tragic 5.4% |
| Trinidadians and Tobagonians | 0.6 /100 | #252 | Tragic 5.4% |
| Immigrants | Sierra Leone | 0.6 /100 | #253 | Tragic 5.4% |
| Paraguayans | 0.5 /100 | #254 | Tragic 5.4% |
| Immigrants | Peru | 0.5 /100 | #255 | Tragic 5.4% |
| Moroccans | 0.5 /100 | #256 | Tragic 5.4% |
| Immigrants | Micronesia | 0.4 /100 | #257 | Tragic 5.4% |