Potawatomi vs Palestinian Married-Couple Family Poverty
COMPARE
Potawatomi
Palestinian
Married-Couple Family Poverty
Married-Couple Family Poverty Comparison
Potawatomi
Palestinians
5.5%
MARRIED-COUPLE FAMILY POVERTY
12.4/ 100
METRIC RATING
216th/ 347
METRIC RANK
4.9%
MARRIED-COUPLE FAMILY POVERTY
91.2/ 100
METRIC RATING
128th/ 347
METRIC RANK
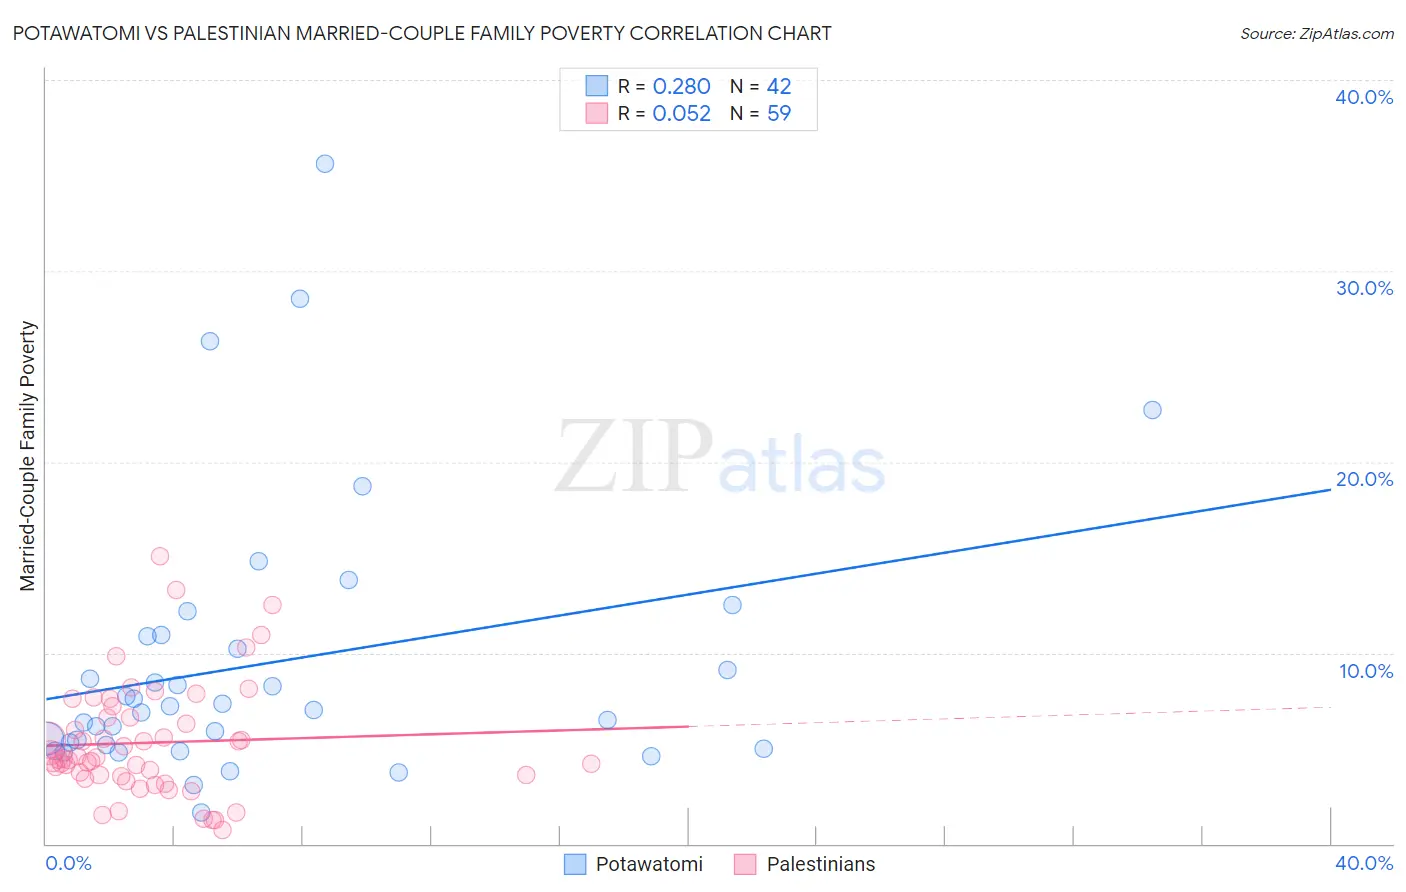
Potawatomi vs Palestinian Married-Couple Family Poverty Correlation Chart
The statistical analysis conducted on geographies consisting of 117,481,648 people shows a weak positive correlation between the proportion of Potawatomi and poverty level among married-couple families in the United States with a correlation coefficient (R) of 0.280 and weighted average of 5.5%. Similarly, the statistical analysis conducted on geographies consisting of 215,628,863 people shows a slight positive correlation between the proportion of Palestinians and poverty level among married-couple families in the United States with a correlation coefficient (R) of 0.052 and weighted average of 4.9%, a difference of 13.4%.
Married-Couple Family Poverty Correlation Summary
| Measurement | Potawatomi | Palestinian |
| Minimum | 1.6% | 0.73% |
| Maximum | 35.6% | 15.1% |
| Range | 34.0% | 14.3% |
| Mean | 9.5% | 5.3% |
| Median | 7.1% | 4.4% |
| Interquartile 25% (IQ1) | 5.2% | 3.6% |
| Interquartile 75% (IQ3) | 10.9% | 6.6% |
| Interquartile Range (IQR) | 5.7% | 3.0% |
| Standard Deviation (Sample) | 7.2% | 3.0% |
| Standard Deviation (Population) | 7.1% | 3.0% |
Similar Demographics by Married-Couple Family Poverty
Demographics Similar to Potawatomi by Married-Couple Family Poverty
In terms of married-couple family poverty, the demographic groups most similar to Potawatomi are Armenian (5.5%, a difference of 0.12%), Iroquois (5.5%, a difference of 0.18%), Immigrants from Liberia (5.5%, a difference of 0.23%), Immigrants from Nigeria (5.5%, a difference of 0.29%), and Afghan (5.5%, a difference of 0.31%).
| Demographics | Rating | Rank | Married-Couple Family Poverty |
| Immigrants | Syria | 15.4 /100 | #209 | Poor 5.5% |
| Immigrants | Micronesia | 14.4 /100 | #210 | Poor 5.5% |
| Nigerians | 14.3 /100 | #211 | Poor 5.5% |
| Immigrants | Thailand | 14.0 /100 | #212 | Poor 5.5% |
| Immigrants | Liberia | 13.3 /100 | #213 | Poor 5.5% |
| Iroquois | 13.1 /100 | #214 | Poor 5.5% |
| Armenians | 12.8 /100 | #215 | Poor 5.5% |
| Potawatomi | 12.4 /100 | #216 | Poor 5.5% |
| Immigrants | Nigeria | 11.3 /100 | #217 | Poor 5.5% |
| Afghans | 11.2 /100 | #218 | Poor 5.5% |
| Japanese | 9.8 /100 | #219 | Tragic 5.6% |
| Colombians | 9.2 /100 | #220 | Tragic 5.6% |
| Panamanians | 9.2 /100 | #221 | Tragic 5.6% |
| Cajuns | 6.9 /100 | #222 | Tragic 5.6% |
| Immigrants | Fiji | 6.7 /100 | #223 | Tragic 5.6% |
Demographics Similar to Palestinians by Married-Couple Family Poverty
In terms of married-couple family poverty, the demographic groups most similar to Palestinians are Immigrants from Pakistan (4.9%, a difference of 0.20%), Soviet Union (4.9%, a difference of 0.21%), Immigrants from Eastern Europe (4.9%, a difference of 0.28%), Puget Sound Salish (4.9%, a difference of 0.29%), and Egyptian (4.8%, a difference of 0.32%).
| Demographics | Rating | Rank | Married-Couple Family Poverty |
| Indians (Asian) | 93.2 /100 | #121 | Exceptional 4.8% |
| Whites/Caucasians | 93.1 /100 | #122 | Exceptional 4.8% |
| Jordanians | 93.1 /100 | #123 | Exceptional 4.8% |
| Romanians | 92.5 /100 | #124 | Exceptional 4.8% |
| Immigrants | Bosnia and Herzegovina | 92.5 /100 | #125 | Exceptional 4.8% |
| Immigrants | Asia | 92.3 /100 | #126 | Exceptional 4.8% |
| Egyptians | 92.0 /100 | #127 | Exceptional 4.8% |
| Palestinians | 91.2 /100 | #128 | Exceptional 4.9% |
| Immigrants | Pakistan | 90.7 /100 | #129 | Exceptional 4.9% |
| Soviet Union | 90.7 /100 | #130 | Exceptional 4.9% |
| Immigrants | Eastern Europe | 90.5 /100 | #131 | Exceptional 4.9% |
| Puget Sound Salish | 90.4 /100 | #132 | Exceptional 4.9% |
| Immigrants | Kenya | 90.2 /100 | #133 | Exceptional 4.9% |
| Samoans | 90.2 /100 | #134 | Exceptional 4.9% |
| Assyrians/Chaldeans/Syriacs | 89.4 /100 | #135 | Excellent 4.9% |