Peruvian vs Soviet Union Female Poverty
COMPARE
Peruvian
Soviet Union
Female Poverty
Female Poverty Comparison
Peruvians
Soviet Union
12.9%
FEMALE POVERTY
85.2/ 100
METRIC RATING
136th/ 347
METRIC RANK
12.6%
FEMALE POVERTY
92.4/ 100
METRIC RATING
111th/ 347
METRIC RANK
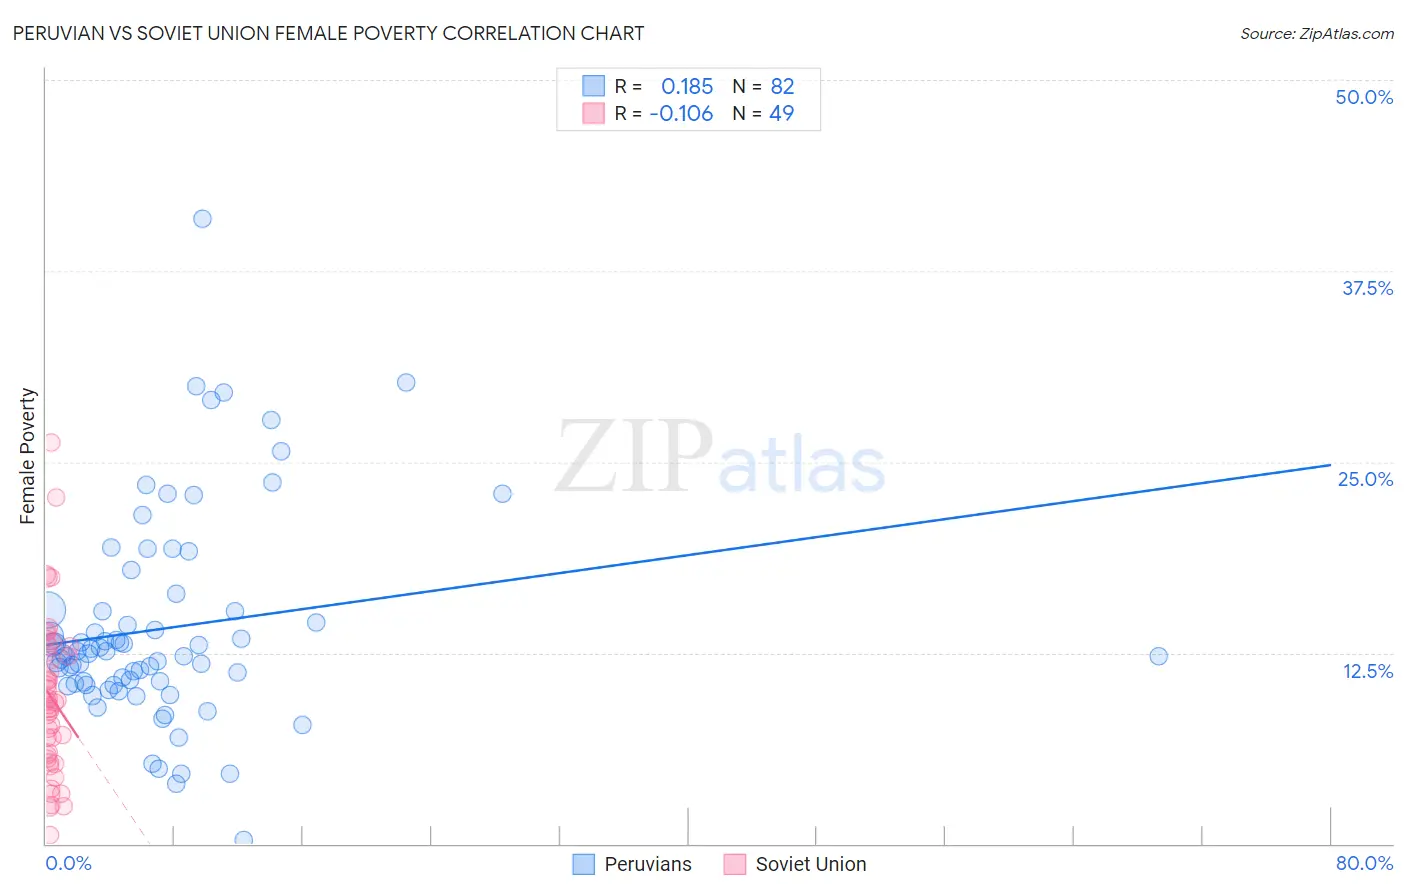
Peruvian vs Soviet Union Female Poverty Correlation Chart
The statistical analysis conducted on geographies consisting of 362,941,638 people shows a poor positive correlation between the proportion of Peruvians and poverty level among females in the United States with a correlation coefficient (R) of 0.185 and weighted average of 12.9%. Similarly, the statistical analysis conducted on geographies consisting of 43,449,399 people shows a poor negative correlation between the proportion of Soviet Union and poverty level among females in the United States with a correlation coefficient (R) of -0.106 and weighted average of 12.6%, a difference of 1.9%.
Female Poverty Correlation Summary
| Measurement | Peruvian | Soviet Union |
| Minimum | 0.21% | 0.56% |
| Maximum | 40.9% | 26.3% |
| Range | 40.7% | 25.7% |
| Mean | 14.1% | 9.6% |
| Median | 12.5% | 9.2% |
| Interquartile 25% (IQ1) | 10.5% | 5.7% |
| Interquartile 75% (IQ3) | 15.2% | 12.7% |
| Interquartile Range (IQR) | 4.8% | 7.0% |
| Standard Deviation (Sample) | 6.8% | 5.2% |
| Standard Deviation (Population) | 6.8% | 5.1% |
Similar Demographics by Female Poverty
Demographics Similar to Peruvians by Female Poverty
In terms of female poverty, the demographic groups most similar to Peruvians are French (12.9%, a difference of 0.080%), Chilean (12.9%, a difference of 0.090%), Immigrants from Switzerland (12.9%, a difference of 0.13%), Immigrants from Western Europe (12.8%, a difference of 0.30%), and Immigrants from France (12.9%, a difference of 0.31%).
| Demographics | Rating | Rank | Female Poverty |
| Immigrants | Brazil | 87.9 /100 | #129 | Excellent 12.8% |
| Immigrants | Vietnam | 87.1 /100 | #130 | Excellent 12.8% |
| Immigrants | Argentina | 87.0 /100 | #131 | Excellent 12.8% |
| Immigrants | Jordan | 86.9 /100 | #132 | Excellent 12.8% |
| Immigrants | Western Europe | 86.6 /100 | #133 | Excellent 12.8% |
| Immigrants | Switzerland | 85.8 /100 | #134 | Excellent 12.9% |
| French | 85.6 /100 | #135 | Excellent 12.9% |
| Peruvians | 85.2 /100 | #136 | Excellent 12.9% |
| Chileans | 84.7 /100 | #137 | Excellent 12.9% |
| Immigrants | France | 83.6 /100 | #138 | Excellent 12.9% |
| Basques | 83.1 /100 | #139 | Excellent 12.9% |
| Pakistanis | 83.0 /100 | #140 | Excellent 12.9% |
| Icelanders | 81.1 /100 | #141 | Excellent 13.0% |
| Brazilians | 80.5 /100 | #142 | Excellent 13.0% |
| Immigrants | Malaysia | 80.4 /100 | #143 | Excellent 13.0% |
Demographics Similar to Soviet Union by Female Poverty
In terms of female poverty, the demographic groups most similar to Soviet Union are Immigrants from Israel (12.6%, a difference of 0.14%), Canadian (12.7%, a difference of 0.17%), Paraguayan (12.6%, a difference of 0.22%), Immigrants from Zimbabwe (12.6%, a difference of 0.25%), and Portuguese (12.6%, a difference of 0.27%).
| Demographics | Rating | Rank | Female Poverty |
| Palestinians | 94.3 /100 | #104 | Exceptional 12.5% |
| Scottish | 94.1 /100 | #105 | Exceptional 12.5% |
| Immigrants | Turkey | 93.8 /100 | #106 | Exceptional 12.6% |
| Laotians | 93.4 /100 | #107 | Exceptional 12.6% |
| Portuguese | 93.1 /100 | #108 | Exceptional 12.6% |
| Immigrants | Zimbabwe | 93.1 /100 | #109 | Exceptional 12.6% |
| Paraguayans | 93.0 /100 | #110 | Exceptional 12.6% |
| Soviet Union | 92.4 /100 | #111 | Exceptional 12.6% |
| Immigrants | Israel | 92.0 /100 | #112 | Exceptional 12.6% |
| Canadians | 92.0 /100 | #113 | Exceptional 12.7% |
| Welsh | 91.6 /100 | #114 | Exceptional 12.7% |
| Puget Sound Salish | 91.5 /100 | #115 | Exceptional 12.7% |
| Immigrants | Russia | 91.2 /100 | #116 | Exceptional 12.7% |
| Immigrants | Southern Europe | 90.9 /100 | #117 | Exceptional 12.7% |
| Sri Lankans | 90.9 /100 | #118 | Exceptional 12.7% |