Jamaican vs Soviet Union Female Poverty
COMPARE
Jamaican
Soviet Union
Female Poverty
Female Poverty Comparison
Jamaicans
Soviet Union
15.5%
FEMALE POVERTY
0.2/ 100
METRIC RATING
256th/ 347
METRIC RANK
12.6%
FEMALE POVERTY
92.4/ 100
METRIC RATING
111th/ 347
METRIC RANK
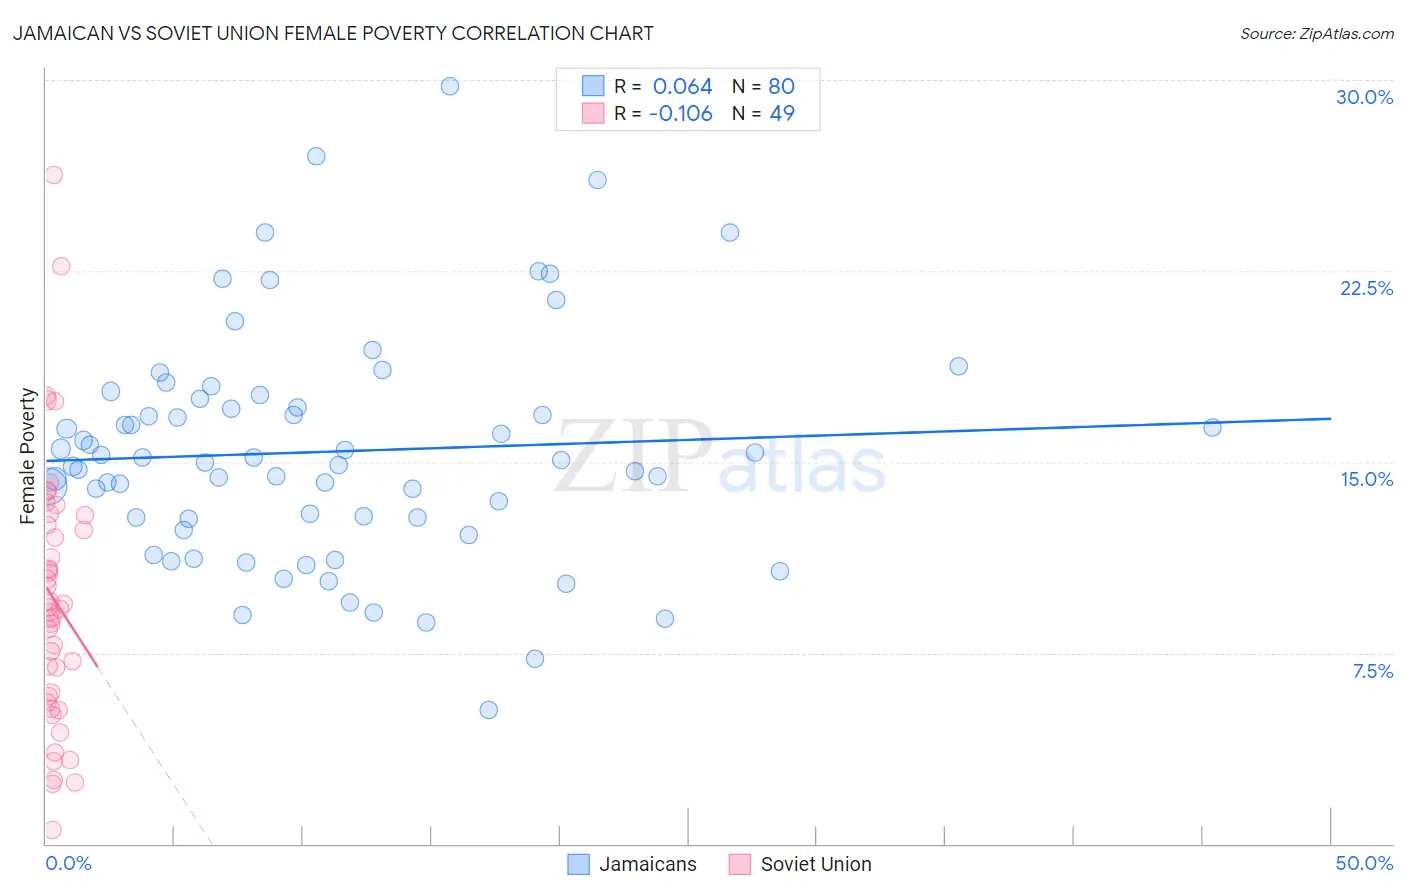
Jamaican vs Soviet Union Female Poverty Correlation Chart
The statistical analysis conducted on geographies consisting of 367,594,174 people shows a slight positive correlation between the proportion of Jamaicans and poverty level among females in the United States with a correlation coefficient (R) of 0.064 and weighted average of 15.5%. Similarly, the statistical analysis conducted on geographies consisting of 43,449,399 people shows a poor negative correlation between the proportion of Soviet Union and poverty level among females in the United States with a correlation coefficient (R) of -0.106 and weighted average of 12.6%, a difference of 23.0%.
Female Poverty Correlation Summary
| Measurement | Jamaican | Soviet Union |
| Minimum | 5.3% | 0.56% |
| Maximum | 29.8% | 26.3% |
| Range | 24.5% | 25.7% |
| Mean | 15.4% | 9.6% |
| Median | 15.0% | 9.2% |
| Interquartile 25% (IQ1) | 12.8% | 5.7% |
| Interquartile 75% (IQ3) | 17.3% | 12.7% |
| Interquartile Range (IQR) | 4.5% | 7.0% |
| Standard Deviation (Sample) | 4.5% | 5.2% |
| Standard Deviation (Population) | 4.5% | 5.1% |
Similar Demographics by Female Poverty
Demographics Similar to Jamaicans by Female Poverty
In terms of female poverty, the demographic groups most similar to Jamaicans are Immigrants from Jamaica (15.6%, a difference of 0.12%), Shoshone (15.6%, a difference of 0.19%), Ottawa (15.5%, a difference of 0.30%), Cape Verdean (15.6%, a difference of 0.30%), and Immigrants from Guyana (15.6%, a difference of 0.38%).
| Demographics | Rating | Rank | Female Poverty |
| Salvadorans | 0.3 /100 | #249 | Tragic 15.3% |
| Immigrants | Western Africa | 0.3 /100 | #250 | Tragic 15.3% |
| Immigrants | Trinidad and Tobago | 0.3 /100 | #251 | Tragic 15.4% |
| Immigrants | Burma/Myanmar | 0.3 /100 | #252 | Tragic 15.4% |
| Liberians | 0.2 /100 | #253 | Tragic 15.4% |
| Trinidadians and Tobagonians | 0.2 /100 | #254 | Tragic 15.4% |
| Ottawa | 0.2 /100 | #255 | Tragic 15.5% |
| Jamaicans | 0.2 /100 | #256 | Tragic 15.5% |
| Immigrants | Jamaica | 0.1 /100 | #257 | Tragic 15.6% |
| Shoshone | 0.1 /100 | #258 | Tragic 15.6% |
| Cape Verdeans | 0.1 /100 | #259 | Tragic 15.6% |
| Immigrants | Guyana | 0.1 /100 | #260 | Tragic 15.6% |
| Guyanese | 0.1 /100 | #261 | Tragic 15.6% |
| Mexican American Indians | 0.1 /100 | #262 | Tragic 15.6% |
| Cherokee | 0.1 /100 | #263 | Tragic 15.6% |
Demographics Similar to Soviet Union by Female Poverty
In terms of female poverty, the demographic groups most similar to Soviet Union are Immigrants from Israel (12.6%, a difference of 0.14%), Canadian (12.7%, a difference of 0.17%), Paraguayan (12.6%, a difference of 0.22%), Immigrants from Zimbabwe (12.6%, a difference of 0.25%), and Portuguese (12.6%, a difference of 0.27%).
| Demographics | Rating | Rank | Female Poverty |
| Palestinians | 94.3 /100 | #104 | Exceptional 12.5% |
| Scottish | 94.1 /100 | #105 | Exceptional 12.5% |
| Immigrants | Turkey | 93.8 /100 | #106 | Exceptional 12.6% |
| Laotians | 93.4 /100 | #107 | Exceptional 12.6% |
| Portuguese | 93.1 /100 | #108 | Exceptional 12.6% |
| Immigrants | Zimbabwe | 93.1 /100 | #109 | Exceptional 12.6% |
| Paraguayans | 93.0 /100 | #110 | Exceptional 12.6% |
| Soviet Union | 92.4 /100 | #111 | Exceptional 12.6% |
| Immigrants | Israel | 92.0 /100 | #112 | Exceptional 12.6% |
| Canadians | 92.0 /100 | #113 | Exceptional 12.7% |
| Welsh | 91.6 /100 | #114 | Exceptional 12.7% |
| Puget Sound Salish | 91.5 /100 | #115 | Exceptional 12.7% |
| Immigrants | Russia | 91.2 /100 | #116 | Exceptional 12.7% |
| Immigrants | Southern Europe | 90.9 /100 | #117 | Exceptional 12.7% |
| Sri Lankans | 90.9 /100 | #118 | Exceptional 12.7% |