Paiute vs Soviet Union Female Poverty
COMPARE
Paiute
Soviet Union
Female Poverty
Female Poverty Comparison
Paiute
Soviet Union
17.7%
FEMALE POVERTY
0.0/ 100
METRIC RATING
323rd/ 347
METRIC RANK
12.6%
FEMALE POVERTY
92.4/ 100
METRIC RATING
111th/ 347
METRIC RANK
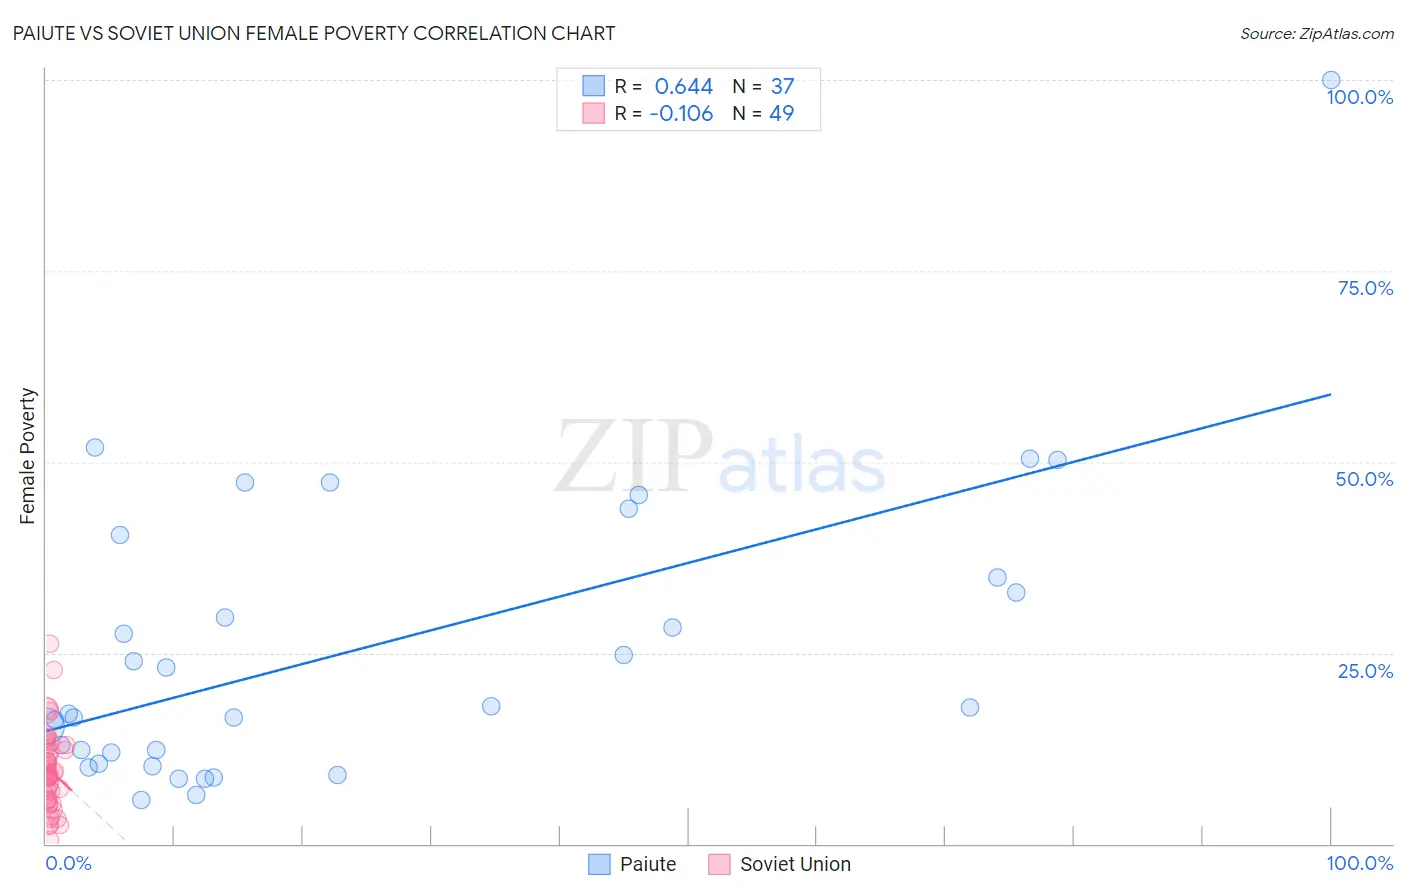
Paiute vs Soviet Union Female Poverty Correlation Chart
The statistical analysis conducted on geographies consisting of 58,391,472 people shows a significant positive correlation between the proportion of Paiute and poverty level among females in the United States with a correlation coefficient (R) of 0.644 and weighted average of 17.7%. Similarly, the statistical analysis conducted on geographies consisting of 43,449,399 people shows a poor negative correlation between the proportion of Soviet Union and poverty level among females in the United States with a correlation coefficient (R) of -0.106 and weighted average of 12.6%, a difference of 40.1%.
Female Poverty Correlation Summary
| Measurement | Paiute | Soviet Union |
| Minimum | 5.7% | 0.56% |
| Maximum | 100.0% | 26.3% |
| Range | 94.3% | 25.7% |
| Mean | 25.6% | 9.6% |
| Median | 17.8% | 9.2% |
| Interquartile 25% (IQ1) | 11.2% | 5.7% |
| Interquartile 75% (IQ3) | 37.6% | 12.7% |
| Interquartile Range (IQR) | 26.4% | 7.0% |
| Standard Deviation (Sample) | 19.3% | 5.2% |
| Standard Deviation (Population) | 19.0% | 5.1% |
Similar Demographics by Female Poverty
Demographics Similar to Paiute by Female Poverty
In terms of female poverty, the demographic groups most similar to Paiute are Immigrants from Honduras (17.7%, a difference of 0.18%), Colville (17.8%, a difference of 0.34%), Menominee (17.6%, a difference of 0.59%), Arapaho (17.5%, a difference of 1.3%), and Immigrants from Dominica (17.5%, a difference of 1.3%).
| Demographics | Rating | Rank | Female Poverty |
| Hondurans | 0.0 /100 | #316 | Tragic 17.4% |
| Immigrants | Congo | 0.0 /100 | #317 | Tragic 17.4% |
| Ute | 0.0 /100 | #318 | Tragic 17.5% |
| Cajuns | 0.0 /100 | #319 | Tragic 17.5% |
| Immigrants | Dominica | 0.0 /100 | #320 | Tragic 17.5% |
| Arapaho | 0.0 /100 | #321 | Tragic 17.5% |
| Menominee | 0.0 /100 | #322 | Tragic 17.6% |
| Paiute | 0.0 /100 | #323 | Tragic 17.7% |
| Immigrants | Honduras | 0.0 /100 | #324 | Tragic 17.7% |
| Colville | 0.0 /100 | #325 | Tragic 17.8% |
| Central American Indians | 0.0 /100 | #326 | Tragic 18.0% |
| Yakama | 0.0 /100 | #327 | Tragic 18.0% |
| Blacks/African Americans | 0.0 /100 | #328 | Tragic 18.6% |
| Kiowa | 0.0 /100 | #329 | Tragic 18.6% |
| Dominicans | 0.0 /100 | #330 | Tragic 19.1% |
Demographics Similar to Soviet Union by Female Poverty
In terms of female poverty, the demographic groups most similar to Soviet Union are Immigrants from Israel (12.6%, a difference of 0.14%), Canadian (12.7%, a difference of 0.17%), Paraguayan (12.6%, a difference of 0.22%), Immigrants from Zimbabwe (12.6%, a difference of 0.25%), and Portuguese (12.6%, a difference of 0.27%).
| Demographics | Rating | Rank | Female Poverty |
| Palestinians | 94.3 /100 | #104 | Exceptional 12.5% |
| Scottish | 94.1 /100 | #105 | Exceptional 12.5% |
| Immigrants | Turkey | 93.8 /100 | #106 | Exceptional 12.6% |
| Laotians | 93.4 /100 | #107 | Exceptional 12.6% |
| Portuguese | 93.1 /100 | #108 | Exceptional 12.6% |
| Immigrants | Zimbabwe | 93.1 /100 | #109 | Exceptional 12.6% |
| Paraguayans | 93.0 /100 | #110 | Exceptional 12.6% |
| Soviet Union | 92.4 /100 | #111 | Exceptional 12.6% |
| Immigrants | Israel | 92.0 /100 | #112 | Exceptional 12.6% |
| Canadians | 92.0 /100 | #113 | Exceptional 12.7% |
| Welsh | 91.6 /100 | #114 | Exceptional 12.7% |
| Puget Sound Salish | 91.5 /100 | #115 | Exceptional 12.7% |
| Immigrants | Russia | 91.2 /100 | #116 | Exceptional 12.7% |
| Immigrants | Southern Europe | 90.9 /100 | #117 | Exceptional 12.7% |
| Sri Lankans | 90.9 /100 | #118 | Exceptional 12.7% |