Peruvian vs Immigrants from Bulgaria Female Poverty
COMPARE
Peruvian
Immigrants from Bulgaria
Female Poverty
Female Poverty Comparison
Peruvians
Immigrants from Bulgaria
12.9%
FEMALE POVERTY
85.2/ 100
METRIC RATING
136th/ 347
METRIC RANK
12.0%
FEMALE POVERTY
98.9/ 100
METRIC RATING
51st/ 347
METRIC RANK
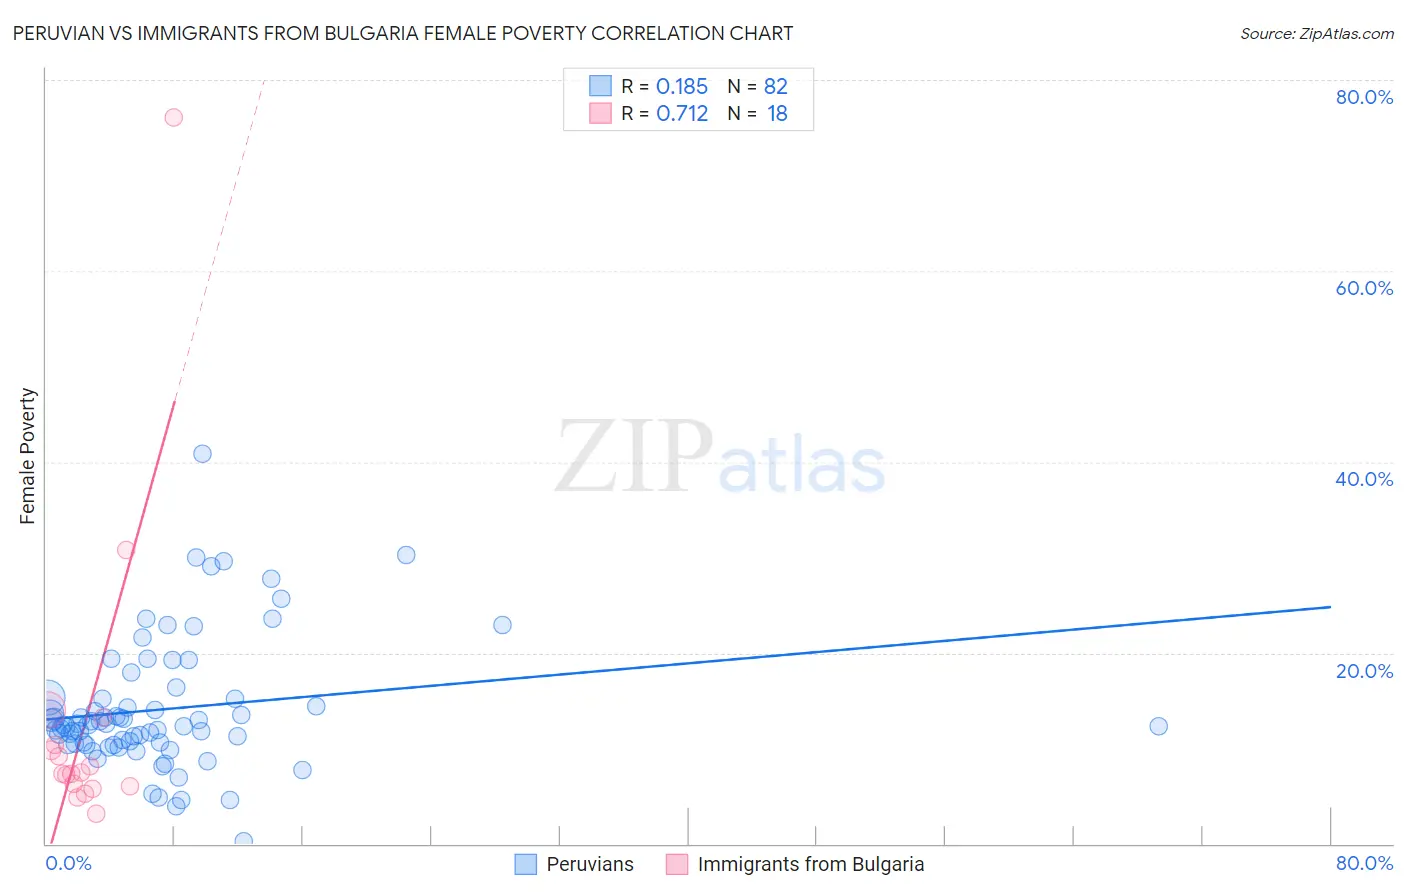
Peruvian vs Immigrants from Bulgaria Female Poverty Correlation Chart
The statistical analysis conducted on geographies consisting of 362,941,638 people shows a poor positive correlation between the proportion of Peruvians and poverty level among females in the United States with a correlation coefficient (R) of 0.185 and weighted average of 12.9%. Similarly, the statistical analysis conducted on geographies consisting of 172,523,298 people shows a strong positive correlation between the proportion of Immigrants from Bulgaria and poverty level among females in the United States with a correlation coefficient (R) of 0.712 and weighted average of 12.0%, a difference of 7.3%.
Female Poverty Correlation Summary
| Measurement | Peruvian | Immigrants from Bulgaria |
| Minimum | 0.21% | 3.1% |
| Maximum | 40.9% | 76.0% |
| Range | 40.7% | 72.9% |
| Mean | 14.1% | 12.9% |
| Median | 12.5% | 7.4% |
| Interquartile 25% (IQ1) | 10.5% | 6.0% |
| Interquartile 75% (IQ3) | 15.2% | 10.3% |
| Interquartile Range (IQR) | 4.8% | 4.3% |
| Standard Deviation (Sample) | 6.8% | 16.9% |
| Standard Deviation (Population) | 6.8% | 16.4% |
Similar Demographics by Female Poverty
Demographics Similar to Peruvians by Female Poverty
In terms of female poverty, the demographic groups most similar to Peruvians are French (12.9%, a difference of 0.080%), Chilean (12.9%, a difference of 0.090%), Immigrants from Switzerland (12.9%, a difference of 0.13%), Immigrants from Western Europe (12.8%, a difference of 0.30%), and Immigrants from France (12.9%, a difference of 0.31%).
| Demographics | Rating | Rank | Female Poverty |
| Immigrants | Brazil | 87.9 /100 | #129 | Excellent 12.8% |
| Immigrants | Vietnam | 87.1 /100 | #130 | Excellent 12.8% |
| Immigrants | Argentina | 87.0 /100 | #131 | Excellent 12.8% |
| Immigrants | Jordan | 86.9 /100 | #132 | Excellent 12.8% |
| Immigrants | Western Europe | 86.6 /100 | #133 | Excellent 12.8% |
| Immigrants | Switzerland | 85.8 /100 | #134 | Excellent 12.9% |
| French | 85.6 /100 | #135 | Excellent 12.9% |
| Peruvians | 85.2 /100 | #136 | Excellent 12.9% |
| Chileans | 84.7 /100 | #137 | Excellent 12.9% |
| Immigrants | France | 83.6 /100 | #138 | Excellent 12.9% |
| Basques | 83.1 /100 | #139 | Excellent 12.9% |
| Pakistanis | 83.0 /100 | #140 | Excellent 12.9% |
| Icelanders | 81.1 /100 | #141 | Excellent 13.0% |
| Brazilians | 80.5 /100 | #142 | Excellent 13.0% |
| Immigrants | Malaysia | 80.4 /100 | #143 | Excellent 13.0% |
Demographics Similar to Immigrants from Bulgaria by Female Poverty
In terms of female poverty, the demographic groups most similar to Immigrants from Bulgaria are Slovene (12.0%, a difference of 0.22%), Immigrants from Romania (12.0%, a difference of 0.23%), Immigrants from Croatia (12.0%, a difference of 0.31%), Immigrants from Austria (12.0%, a difference of 0.31%), and Immigrants from Japan (11.9%, a difference of 0.42%).
| Demographics | Rating | Rank | Female Poverty |
| Tongans | 99.2 /100 | #44 | Exceptional 11.9% |
| Immigrants | Czechoslovakia | 99.2 /100 | #45 | Exceptional 11.9% |
| Turks | 99.2 /100 | #46 | Exceptional 11.9% |
| Asians | 99.1 /100 | #47 | Exceptional 11.9% |
| Immigrants | Japan | 99.0 /100 | #48 | Exceptional 11.9% |
| Immigrants | Romania | 99.0 /100 | #49 | Exceptional 12.0% |
| Slovenes | 98.9 /100 | #50 | Exceptional 12.0% |
| Immigrants | Bulgaria | 98.9 /100 | #51 | Exceptional 12.0% |
| Immigrants | Croatia | 98.7 /100 | #52 | Exceptional 12.0% |
| Immigrants | Austria | 98.7 /100 | #53 | Exceptional 12.0% |
| Immigrants | Philippines | 98.7 /100 | #54 | Exceptional 12.1% |
| Immigrants | Sri Lanka | 98.5 /100 | #55 | Exceptional 12.1% |
| Estonians | 98.3 /100 | #56 | Exceptional 12.1% |
| Immigrants | Serbia | 98.3 /100 | #57 | Exceptional 12.1% |
| Scandinavians | 98.2 /100 | #58 | Exceptional 12.1% |