Peruvian vs Immigrants from Ecuador Married-Couple Family Poverty
COMPARE
Peruvian
Immigrants from Ecuador
Married-Couple Family Poverty
Married-Couple Family Poverty Comparison
Peruvians
Immigrants from Ecuador
5.3%
MARRIED-COUPLE FAMILY POVERTY
37.6/ 100
METRIC RATING
183rd/ 347
METRIC RANK
6.7%
MARRIED-COUPLE FAMILY POVERTY
0.0/ 100
METRIC RATING
302nd/ 347
METRIC RANK
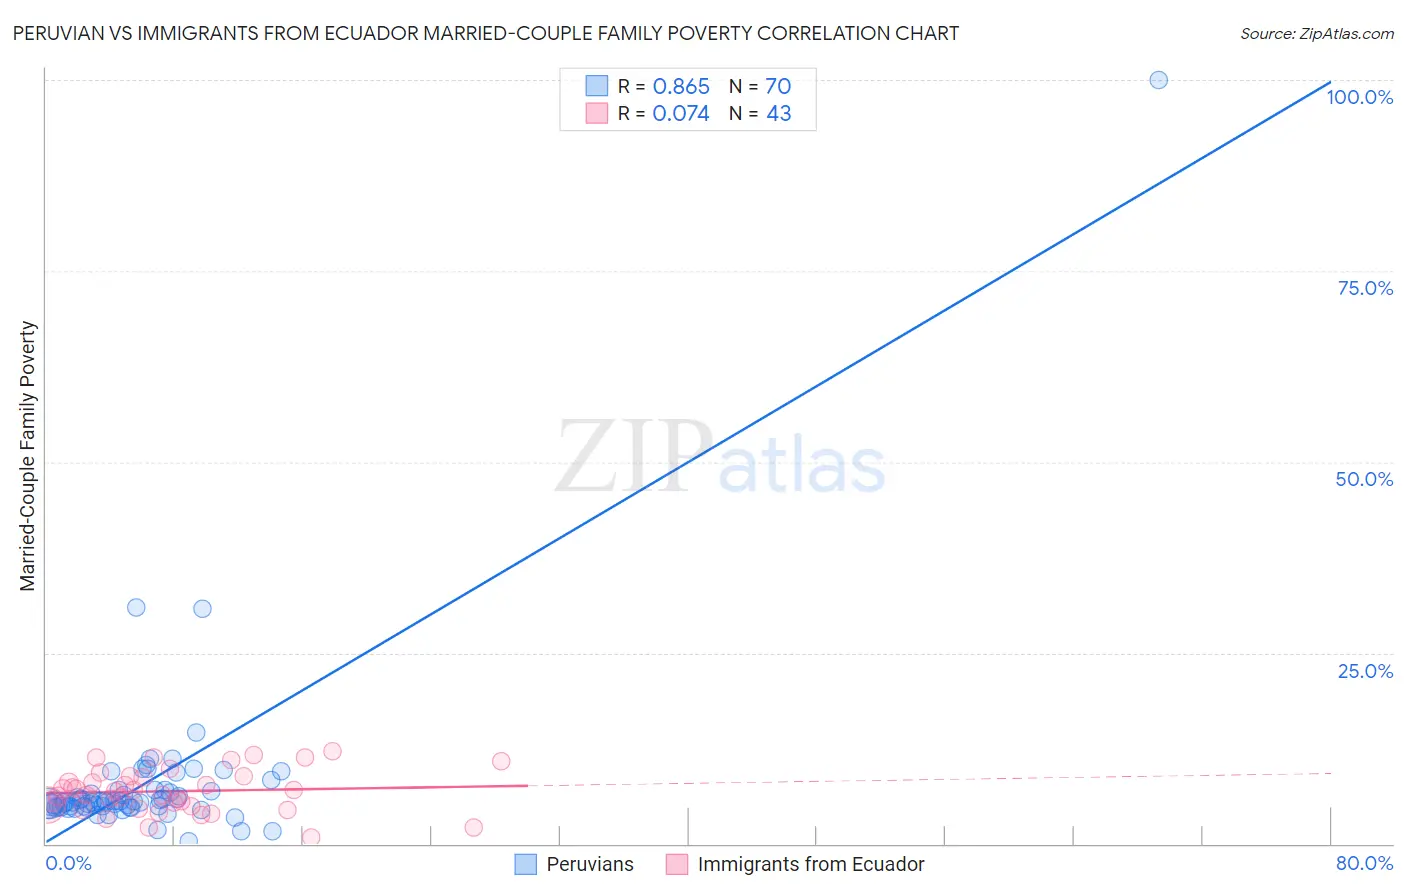
Peruvian vs Immigrants from Ecuador Married-Couple Family Poverty Correlation Chart
The statistical analysis conducted on geographies consisting of 360,614,929 people shows a very strong positive correlation between the proportion of Peruvians and poverty level among married-couple families in the United States with a correlation coefficient (R) of 0.865 and weighted average of 5.3%. Similarly, the statistical analysis conducted on geographies consisting of 269,492,942 people shows a slight positive correlation between the proportion of Immigrants from Ecuador and poverty level among married-couple families in the United States with a correlation coefficient (R) of 0.074 and weighted average of 6.7%, a difference of 27.4%.
Married-Couple Family Poverty Correlation Summary
| Measurement | Peruvian | Immigrants from Ecuador |
| Minimum | 0.26% | 0.76% |
| Maximum | 100.0% | 12.1% |
| Range | 99.7% | 11.3% |
| Mean | 8.0% | 6.9% |
| Median | 5.5% | 6.9% |
| Interquartile 25% (IQ1) | 4.9% | 4.8% |
| Interquartile 75% (IQ3) | 7.0% | 8.8% |
| Interquartile Range (IQR) | 2.2% | 3.9% |
| Standard Deviation (Sample) | 12.1% | 2.8% |
| Standard Deviation (Population) | 12.1% | 2.8% |
Similar Demographics by Married-Couple Family Poverty
Demographics Similar to Peruvians by Married-Couple Family Poverty
In terms of married-couple family poverty, the demographic groups most similar to Peruvians are Immigrants from Vietnam (5.3%, a difference of 0.010%), Immigrants from Chile (5.3%, a difference of 0.14%), Immigrants from Sierra Leone (5.3%, a difference of 0.20%), Nonimmigrants (5.3%, a difference of 0.22%), and American (5.3%, a difference of 0.28%).
| Demographics | Rating | Rank | Married-Couple Family Poverty |
| Menominee | 47.8 /100 | #176 | Average 5.2% |
| Immigrants | Kazakhstan | 45.1 /100 | #177 | Average 5.2% |
| Immigrants | Ukraine | 44.9 /100 | #178 | Average 5.2% |
| Spanish | 41.4 /100 | #179 | Average 5.3% |
| Immigrants | Sierra Leone | 39.3 /100 | #180 | Fair 5.3% |
| Immigrants | Chile | 38.8 /100 | #181 | Fair 5.3% |
| Immigrants | Vietnam | 37.7 /100 | #182 | Fair 5.3% |
| Peruvians | 37.6 /100 | #183 | Fair 5.3% |
| Immigrants | Nonimmigrants | 35.8 /100 | #184 | Fair 5.3% |
| Americans | 35.4 /100 | #185 | Fair 5.3% |
| Hungarians | 34.7 /100 | #186 | Fair 5.3% |
| Immigrants | Albania | 33.8 /100 | #187 | Fair 5.3% |
| Israelis | 33.1 /100 | #188 | Fair 5.3% |
| South American Indians | 32.5 /100 | #189 | Fair 5.3% |
| Ugandans | 31.6 /100 | #190 | Fair 5.3% |
Demographics Similar to Immigrants from Ecuador by Married-Couple Family Poverty
In terms of married-couple family poverty, the demographic groups most similar to Immigrants from Ecuador are Central American (6.7%, a difference of 0.14%), Immigrants from El Salvador (6.8%, a difference of 0.28%), Cuban (6.8%, a difference of 0.72%), Immigrants from Belize (6.7%, a difference of 0.74%), and Haitian (6.8%, a difference of 0.83%).
| Demographics | Rating | Rank | Married-Couple Family Poverty |
| Immigrants | Uzbekistan | 0.0 /100 | #295 | Tragic 6.6% |
| U.S. Virgin Islanders | 0.0 /100 | #296 | Tragic 6.6% |
| Kiowa | 0.0 /100 | #297 | Tragic 6.6% |
| Immigrants | Guyana | 0.0 /100 | #298 | Tragic 6.7% |
| Nicaraguans | 0.0 /100 | #299 | Tragic 6.7% |
| Immigrants | Belize | 0.0 /100 | #300 | Tragic 6.7% |
| Central Americans | 0.0 /100 | #301 | Tragic 6.7% |
| Immigrants | Ecuador | 0.0 /100 | #302 | Tragic 6.7% |
| Immigrants | El Salvador | 0.0 /100 | #303 | Tragic 6.8% |
| Cubans | 0.0 /100 | #304 | Tragic 6.8% |
| Haitians | 0.0 /100 | #305 | Tragic 6.8% |
| Immigrants | Haiti | 0.0 /100 | #306 | Tragic 7.0% |
| Guatemalans | 0.0 /100 | #307 | Tragic 7.0% |
| Spanish American Indians | 0.0 /100 | #308 | Tragic 7.1% |
| Hopi | 0.0 /100 | #309 | Tragic 7.1% |