Panamanian vs Trinidadian and Tobagonian Receiving Food Stamps
COMPARE
Panamanian
Trinidadian and Tobagonian
Receiving Food Stamps
Receiving Food Stamps Comparison
Panamanians
Trinidadians and Tobagonians
13.1%
RECEIVING FOOD STAMPS
3.5/ 100
METRIC RATING
228th/ 347
METRIC RANK
16.0%
RECEIVING FOOD STAMPS
0.0/ 100
METRIC RATING
301st/ 347
METRIC RANK
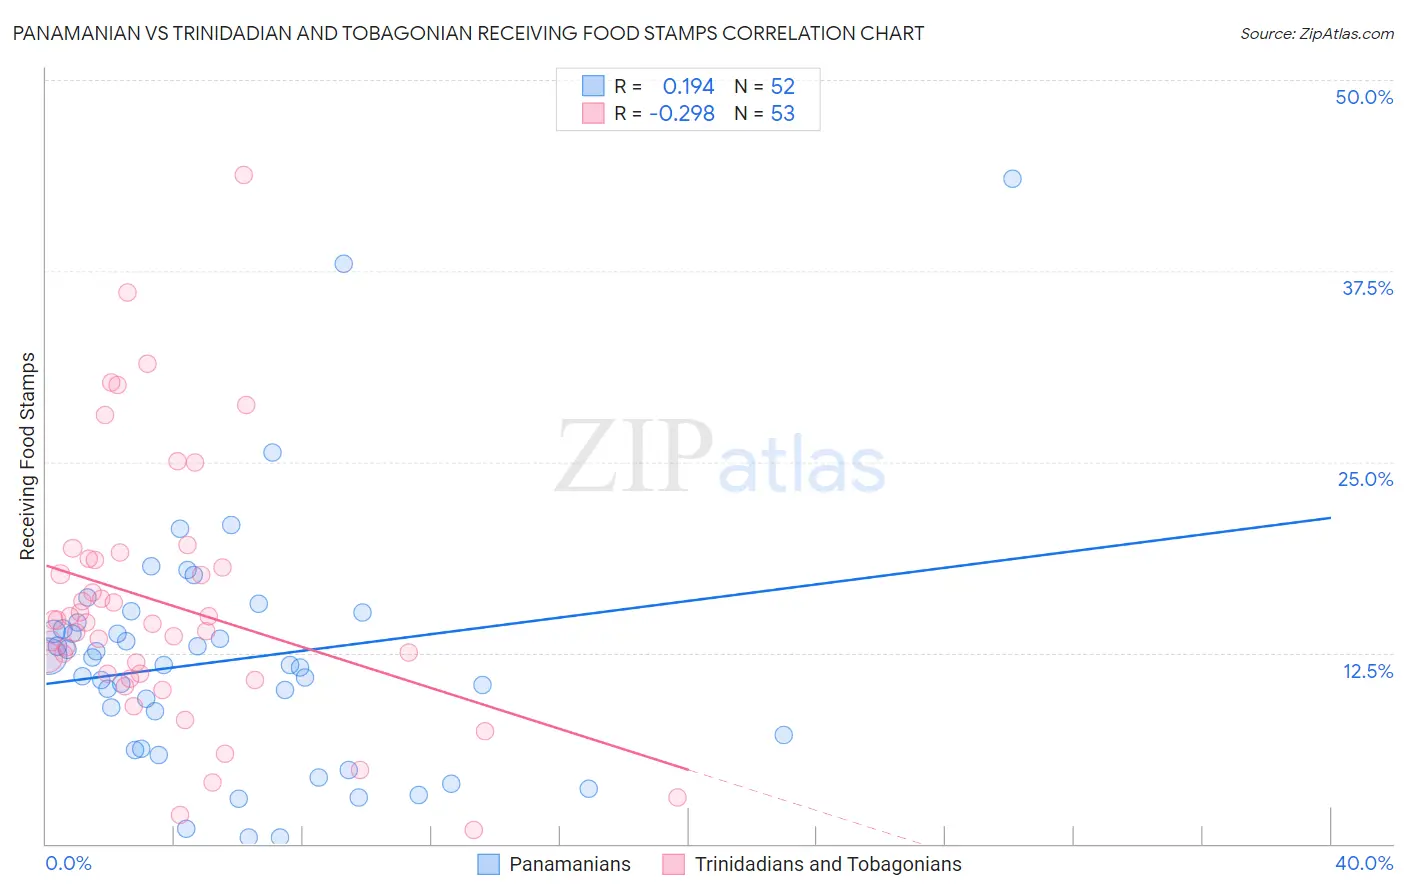
Panamanian vs Trinidadian and Tobagonian Receiving Food Stamps Correlation Chart
The statistical analysis conducted on geographies consisting of 280,789,065 people shows a poor positive correlation between the proportion of Panamanians and percentage of population receiving government assistance and/or food stamps in the United States with a correlation coefficient (R) of 0.194 and weighted average of 13.1%. Similarly, the statistical analysis conducted on geographies consisting of 219,495,740 people shows a weak negative correlation between the proportion of Trinidadians and Tobagonians and percentage of population receiving government assistance and/or food stamps in the United States with a correlation coefficient (R) of -0.298 and weighted average of 16.0%, a difference of 22.0%.
Receiving Food Stamps Correlation Summary
| Measurement | Panamanian | Trinidadian and Tobagonian |
| Minimum | 0.40% | 0.90% |
| Maximum | 43.5% | 43.8% |
| Range | 43.1% | 42.9% |
| Mean | 12.0% | 15.7% |
| Median | 11.7% | 14.5% |
| Interquartile 25% (IQ1) | 6.6% | 10.9% |
| Interquartile 75% (IQ3) | 14.3% | 18.6% |
| Interquartile Range (IQR) | 7.6% | 7.7% |
| Standard Deviation (Sample) | 8.0% | 8.5% |
| Standard Deviation (Population) | 7.9% | 8.4% |
Similar Demographics by Receiving Food Stamps
Demographics Similar to Panamanians by Receiving Food Stamps
In terms of receiving food stamps, the demographic groups most similar to Panamanians are Nigerian (13.1%, a difference of 0.010%), Ottawa (13.1%, a difference of 0.010%), Chickasaw (13.1%, a difference of 0.050%), Puget Sound Salish (13.1%, a difference of 0.060%), and Immigrants from Nigeria (13.1%, a difference of 0.10%).
| Demographics | Rating | Rank | Receiving Food Stamps |
| Bermudans | 4.8 /100 | #221 | Tragic 13.0% |
| Immigrants | Immigrants | 4.4 /100 | #222 | Tragic 13.0% |
| Immigrants | Albania | 4.4 /100 | #223 | Tragic 13.0% |
| Immigrants | Armenia | 4.3 /100 | #224 | Tragic 13.0% |
| Fijians | 4.3 /100 | #225 | Tragic 13.0% |
| Chickasaw | 3.6 /100 | #226 | Tragic 13.1% |
| Nigerians | 3.5 /100 | #227 | Tragic 13.1% |
| Panamanians | 3.5 /100 | #228 | Tragic 13.1% |
| Ottawa | 3.5 /100 | #229 | Tragic 13.1% |
| Puget Sound Salish | 3.4 /100 | #230 | Tragic 13.1% |
| Immigrants | Nigeria | 3.4 /100 | #231 | Tragic 13.1% |
| Salvadorans | 2.7 /100 | #232 | Tragic 13.2% |
| Cherokee | 2.5 /100 | #233 | Tragic 13.2% |
| Comanche | 2.4 /100 | #234 | Tragic 13.3% |
| Immigrants | Zaire | 1.9 /100 | #235 | Tragic 13.4% |
Demographics Similar to Trinidadians and Tobagonians by Receiving Food Stamps
In terms of receiving food stamps, the demographic groups most similar to Trinidadians and Tobagonians are Immigrants from Bangladesh (15.9%, a difference of 0.45%), Hispanic or Latino (15.8%, a difference of 0.89%), Immigrants from West Indies (16.1%, a difference of 0.94%), Nicaraguan (16.1%, a difference of 1.0%), and Immigrants from Trinidad and Tobago (15.8%, a difference of 1.2%).
| Demographics | Rating | Rank | Receiving Food Stamps |
| Immigrants | Latin America | 0.0 /100 | #294 | Tragic 15.7% |
| Immigrants | Honduras | 0.0 /100 | #295 | Tragic 15.7% |
| Tsimshian | 0.0 /100 | #296 | Tragic 15.7% |
| Immigrants | Bahamas | 0.0 /100 | #297 | Tragic 15.8% |
| Immigrants | Trinidad and Tobago | 0.0 /100 | #298 | Tragic 15.8% |
| Hispanics or Latinos | 0.0 /100 | #299 | Tragic 15.8% |
| Immigrants | Bangladesh | 0.0 /100 | #300 | Tragic 15.9% |
| Trinidadians and Tobagonians | 0.0 /100 | #301 | Tragic 16.0% |
| Immigrants | West Indies | 0.0 /100 | #302 | Tragic 16.1% |
| Nicaraguans | 0.0 /100 | #303 | Tragic 16.1% |
| West Indians | 0.0 /100 | #304 | Tragic 16.3% |
| Immigrants | Azores | 0.0 /100 | #305 | Tragic 16.4% |
| Jamaicans | 0.0 /100 | #306 | Tragic 16.4% |
| Houma | 0.0 /100 | #307 | Tragic 16.5% |
| Barbadians | 0.0 /100 | #308 | Tragic 16.5% |