Panamanian vs Native Hawaiian Receiving Food Stamps
COMPARE
Panamanian
Native Hawaiian
Receiving Food Stamps
Receiving Food Stamps Comparison
Panamanians
Native Hawaiians
13.1%
RECEIVING FOOD STAMPS
3.5/ 100
METRIC RATING
228th/ 347
METRIC RANK
12.8%
RECEIVING FOOD STAMPS
6.7/ 100
METRIC RATING
215th/ 347
METRIC RANK
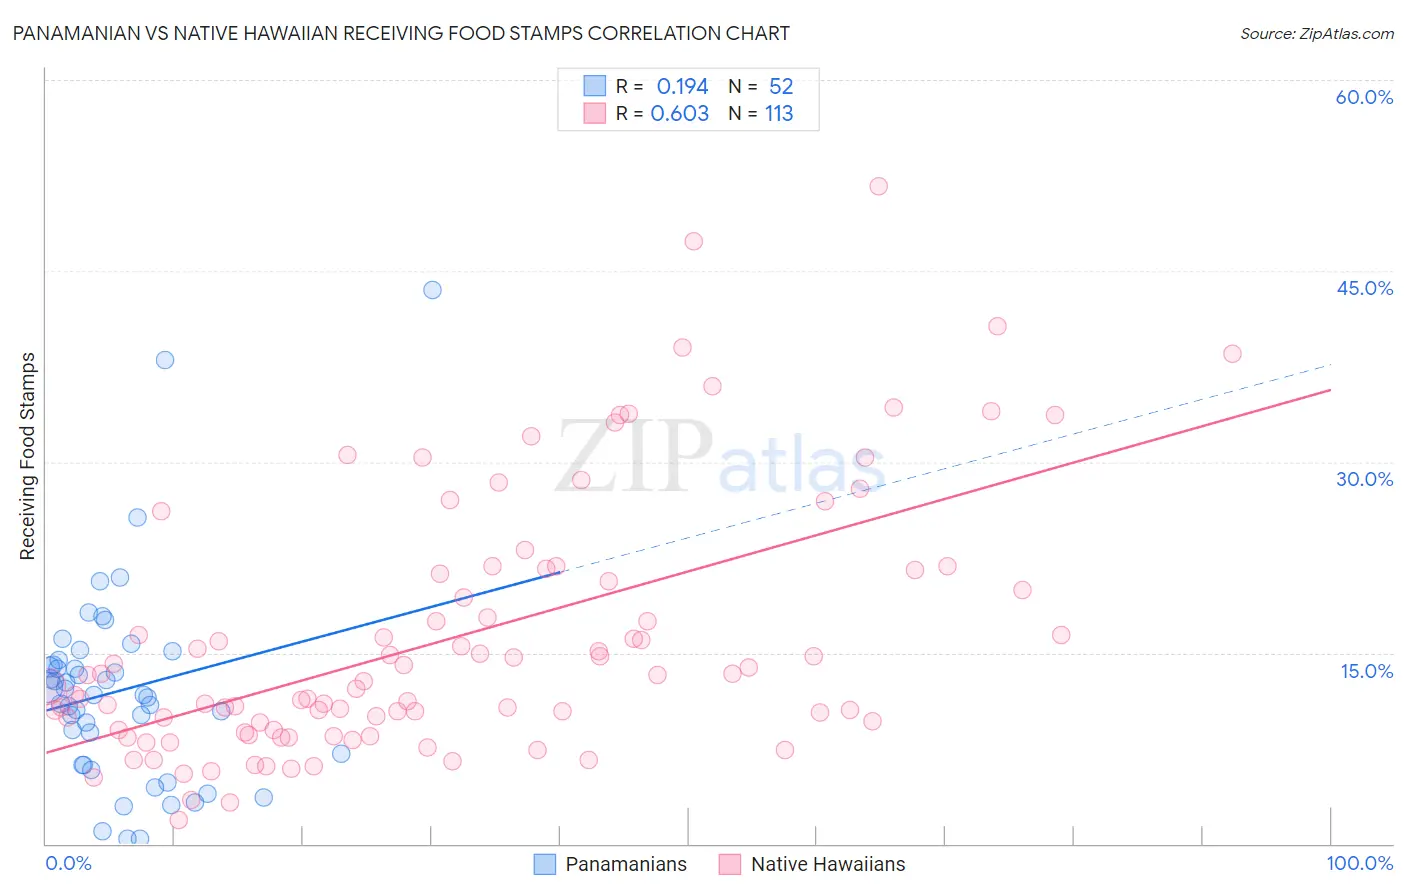
Panamanian vs Native Hawaiian Receiving Food Stamps Correlation Chart
The statistical analysis conducted on geographies consisting of 280,789,065 people shows a poor positive correlation between the proportion of Panamanians and percentage of population receiving government assistance and/or food stamps in the United States with a correlation coefficient (R) of 0.194 and weighted average of 13.1%. Similarly, the statistical analysis conducted on geographies consisting of 331,508,254 people shows a significant positive correlation between the proportion of Native Hawaiians and percentage of population receiving government assistance and/or food stamps in the United States with a correlation coefficient (R) of 0.603 and weighted average of 12.8%, a difference of 2.2%.
Receiving Food Stamps Correlation Summary
| Measurement | Panamanian | Native Hawaiian |
| Minimum | 0.40% | 1.9% |
| Maximum | 43.5% | 51.7% |
| Range | 43.1% | 49.8% |
| Mean | 12.0% | 16.1% |
| Median | 11.7% | 12.8% |
| Interquartile 25% (IQ1) | 6.6% | 9.0% |
| Interquartile 75% (IQ3) | 14.3% | 21.4% |
| Interquartile Range (IQR) | 7.6% | 12.4% |
| Standard Deviation (Sample) | 8.0% | 10.1% |
| Standard Deviation (Population) | 7.9% | 10.1% |
Demographics Similar to Panamanians and Native Hawaiians by Receiving Food Stamps
In terms of receiving food stamps, the demographic groups most similar to Panamanians are Nigerian (13.1%, a difference of 0.010%), Ottawa (13.1%, a difference of 0.010%), Chickasaw (13.1%, a difference of 0.050%), Puget Sound Salish (13.1%, a difference of 0.060%), and Immigrants from Nigeria (13.1%, a difference of 0.10%). Similarly, the demographic groups most similar to Native Hawaiians are Immigrants from South America (12.8%, a difference of 0.11%), Immigrants from Burma/Myanmar (12.9%, a difference of 0.36%), Immigrants from Africa (12.8%, a difference of 0.44%), Moroccan (12.8%, a difference of 0.47%), and Hawaiian (12.9%, a difference of 0.73%).
| Demographics | Rating | Rank | Receiving Food Stamps |
| Colombians | 10.2 /100 | #211 | Poor 12.6% |
| Malaysians | 8.5 /100 | #212 | Tragic 12.7% |
| Moroccans | 7.6 /100 | #213 | Tragic 12.8% |
| Immigrants | Africa | 7.6 /100 | #214 | Tragic 12.8% |
| Native Hawaiians | 6.7 /100 | #215 | Tragic 12.8% |
| Immigrants | South America | 6.5 /100 | #216 | Tragic 12.8% |
| Immigrants | Burma/Myanmar | 6.0 /100 | #217 | Tragic 12.9% |
| Hawaiians | 5.4 /100 | #218 | Tragic 12.9% |
| Immigrants | Middle Africa | 5.4 /100 | #219 | Tragic 12.9% |
| Immigrants | Colombia | 5.3 /100 | #220 | Tragic 12.9% |
| Bermudans | 4.8 /100 | #221 | Tragic 13.0% |
| Immigrants | Immigrants | 4.4 /100 | #222 | Tragic 13.0% |
| Immigrants | Albania | 4.4 /100 | #223 | Tragic 13.0% |
| Immigrants | Armenia | 4.3 /100 | #224 | Tragic 13.0% |
| Fijians | 4.3 /100 | #225 | Tragic 13.0% |
| Chickasaw | 3.6 /100 | #226 | Tragic 13.1% |
| Nigerians | 3.5 /100 | #227 | Tragic 13.1% |
| Panamanians | 3.5 /100 | #228 | Tragic 13.1% |
| Ottawa | 3.5 /100 | #229 | Tragic 13.1% |
| Puget Sound Salish | 3.4 /100 | #230 | Tragic 13.1% |
| Immigrants | Nigeria | 3.4 /100 | #231 | Tragic 13.1% |