Peruvian vs Trinidadian and Tobagonian Receiving Food Stamps
COMPARE
Peruvian
Trinidadian and Tobagonian
Receiving Food Stamps
Receiving Food Stamps Comparison
Peruvians
Trinidadians and Tobagonians
11.7%
RECEIVING FOOD STAMPS
49.3/ 100
METRIC RATING
176th/ 347
METRIC RANK
16.0%
RECEIVING FOOD STAMPS
0.0/ 100
METRIC RATING
301st/ 347
METRIC RANK
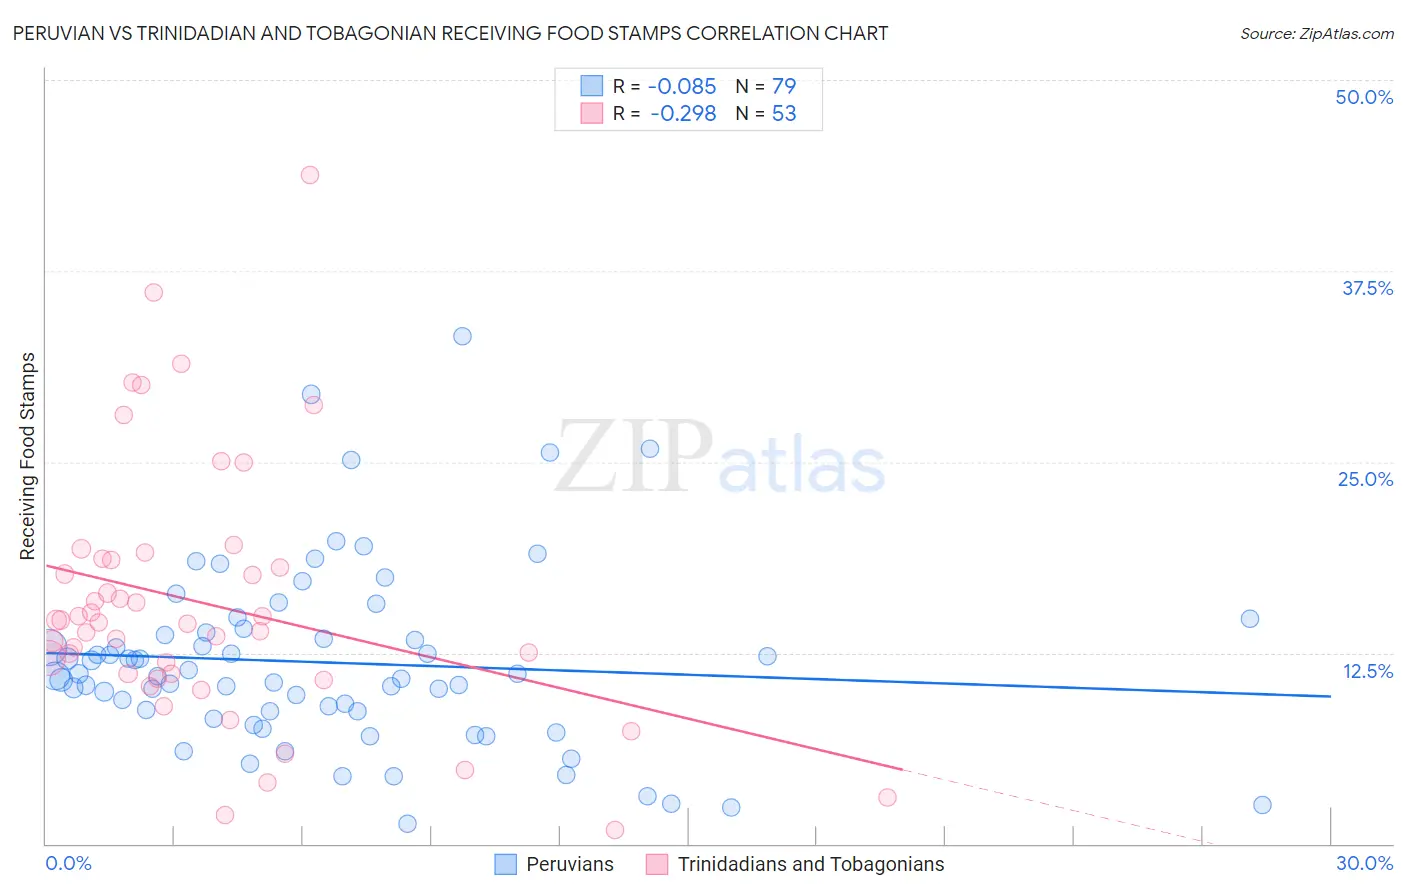
Peruvian vs Trinidadian and Tobagonian Receiving Food Stamps Correlation Chart
The statistical analysis conducted on geographies consisting of 362,284,397 people shows a slight negative correlation between the proportion of Peruvians and percentage of population receiving government assistance and/or food stamps in the United States with a correlation coefficient (R) of -0.085 and weighted average of 11.7%. Similarly, the statistical analysis conducted on geographies consisting of 219,495,740 people shows a weak negative correlation between the proportion of Trinidadians and Tobagonians and percentage of population receiving government assistance and/or food stamps in the United States with a correlation coefficient (R) of -0.298 and weighted average of 16.0%, a difference of 36.0%.
Receiving Food Stamps Correlation Summary
| Measurement | Peruvian | Trinidadian and Tobagonian |
| Minimum | 1.3% | 0.90% |
| Maximum | 33.2% | 43.8% |
| Range | 31.9% | 42.9% |
| Mean | 11.9% | 15.7% |
| Median | 11.0% | 14.5% |
| Interquartile 25% (IQ1) | 8.7% | 10.9% |
| Interquartile 75% (IQ3) | 13.8% | 18.6% |
| Interquartile Range (IQR) | 5.1% | 7.7% |
| Standard Deviation (Sample) | 6.0% | 8.5% |
| Standard Deviation (Population) | 5.9% | 8.4% |
Similar Demographics by Receiving Food Stamps
Demographics Similar to Peruvians by Receiving Food Stamps
In terms of receiving food stamps, the demographic groups most similar to Peruvians are Osage (11.7%, a difference of 0.070%), Immigrants from Eritrea (11.7%, a difference of 0.10%), Immigrants from Ukraine (11.8%, a difference of 0.13%), German Russian (11.8%, a difference of 0.17%), and Immigrants from Kenya (11.8%, a difference of 0.41%).
| Demographics | Rating | Rank | Receiving Food Stamps |
| Immigrants | Eastern Africa | 58.3 /100 | #169 | Average 11.6% |
| Costa Ricans | 57.9 /100 | #170 | Average 11.6% |
| Immigrants | Western Asia | 56.4 /100 | #171 | Average 11.6% |
| Guamanians/Chamorros | 54.2 /100 | #172 | Average 11.7% |
| Immigrants | Syria | 53.4 /100 | #173 | Average 11.7% |
| Immigrants | Eritrea | 50.0 /100 | #174 | Average 11.7% |
| Osage | 49.8 /100 | #175 | Average 11.7% |
| Peruvians | 49.3 /100 | #176 | Average 11.7% |
| Immigrants | Ukraine | 48.4 /100 | #177 | Average 11.8% |
| German Russians | 48.1 /100 | #178 | Average 11.8% |
| Immigrants | Kenya | 46.4 /100 | #179 | Average 11.8% |
| Uruguayans | 44.8 /100 | #180 | Average 11.8% |
| South American Indians | 41.7 /100 | #181 | Average 11.9% |
| Immigrants | Morocco | 40.7 /100 | #182 | Average 11.9% |
| Immigrants | Uganda | 40.3 /100 | #183 | Average 11.9% |
Demographics Similar to Trinidadians and Tobagonians by Receiving Food Stamps
In terms of receiving food stamps, the demographic groups most similar to Trinidadians and Tobagonians are Immigrants from Bangladesh (15.9%, a difference of 0.45%), Hispanic or Latino (15.8%, a difference of 0.89%), Immigrants from West Indies (16.1%, a difference of 0.94%), Nicaraguan (16.1%, a difference of 1.0%), and Immigrants from Trinidad and Tobago (15.8%, a difference of 1.2%).
| Demographics | Rating | Rank | Receiving Food Stamps |
| Immigrants | Latin America | 0.0 /100 | #294 | Tragic 15.7% |
| Immigrants | Honduras | 0.0 /100 | #295 | Tragic 15.7% |
| Tsimshian | 0.0 /100 | #296 | Tragic 15.7% |
| Immigrants | Bahamas | 0.0 /100 | #297 | Tragic 15.8% |
| Immigrants | Trinidad and Tobago | 0.0 /100 | #298 | Tragic 15.8% |
| Hispanics or Latinos | 0.0 /100 | #299 | Tragic 15.8% |
| Immigrants | Bangladesh | 0.0 /100 | #300 | Tragic 15.9% |
| Trinidadians and Tobagonians | 0.0 /100 | #301 | Tragic 16.0% |
| Immigrants | West Indies | 0.0 /100 | #302 | Tragic 16.1% |
| Nicaraguans | 0.0 /100 | #303 | Tragic 16.1% |
| West Indians | 0.0 /100 | #304 | Tragic 16.3% |
| Immigrants | Azores | 0.0 /100 | #305 | Tragic 16.4% |
| Jamaicans | 0.0 /100 | #306 | Tragic 16.4% |
| Houma | 0.0 /100 | #307 | Tragic 16.5% |
| Barbadians | 0.0 /100 | #308 | Tragic 16.5% |