Panamanian vs Immigrants from Denmark Receiving Food Stamps
COMPARE
Panamanian
Immigrants from Denmark
Receiving Food Stamps
Receiving Food Stamps Comparison
Panamanians
Immigrants from Denmark
13.1%
RECEIVING FOOD STAMPS
3.5/ 100
METRIC RATING
228th/ 347
METRIC RANK
9.6%
RECEIVING FOOD STAMPS
99.4/ 100
METRIC RATING
44th/ 347
METRIC RANK
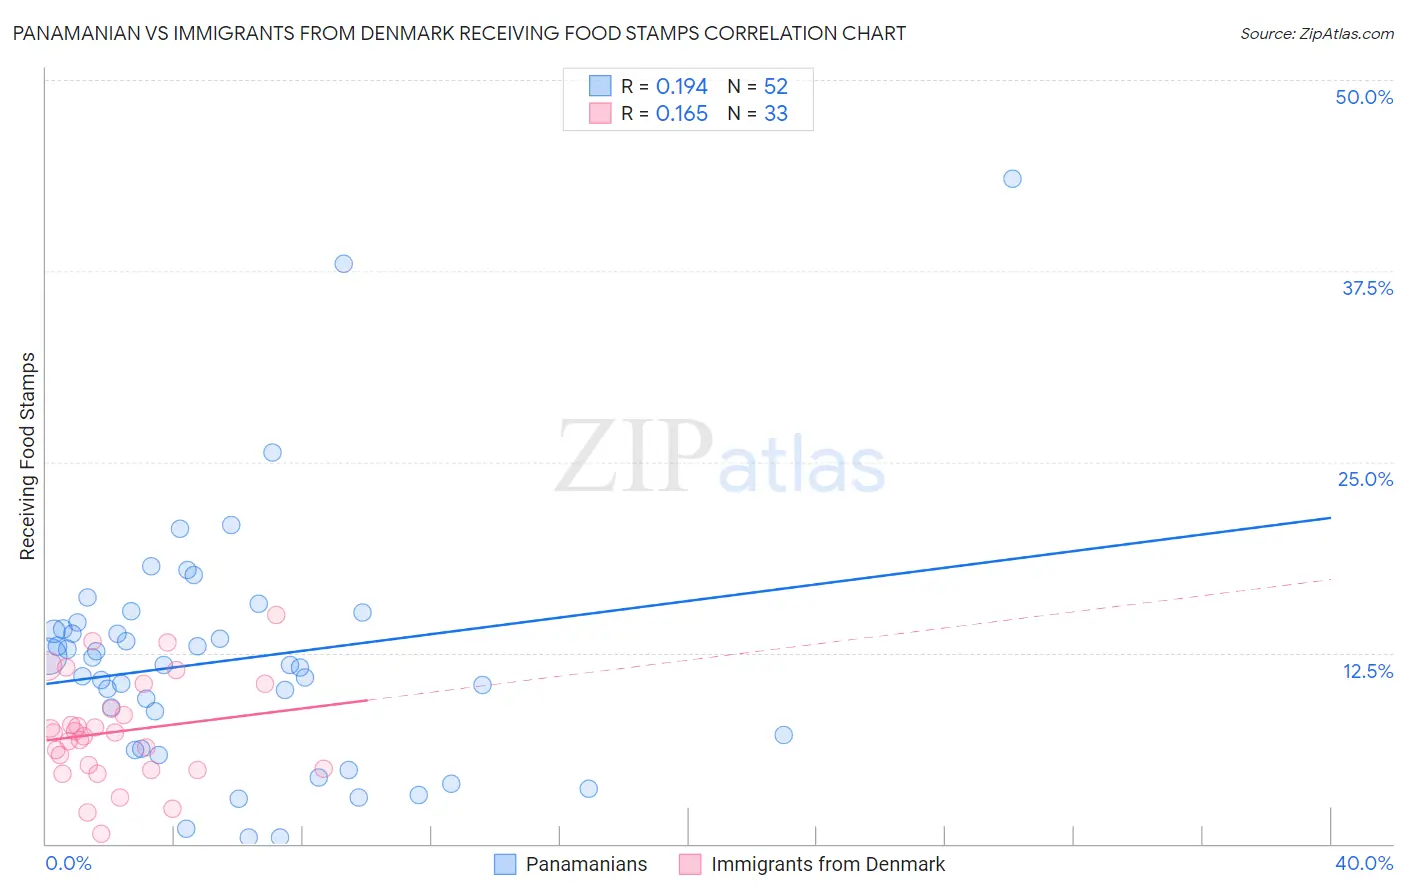
Panamanian vs Immigrants from Denmark Receiving Food Stamps Correlation Chart
The statistical analysis conducted on geographies consisting of 280,789,065 people shows a poor positive correlation between the proportion of Panamanians and percentage of population receiving government assistance and/or food stamps in the United States with a correlation coefficient (R) of 0.194 and weighted average of 13.1%. Similarly, the statistical analysis conducted on geographies consisting of 136,213,097 people shows a poor positive correlation between the proportion of Immigrants from Denmark and percentage of population receiving government assistance and/or food stamps in the United States with a correlation coefficient (R) of 0.165 and weighted average of 9.6%, a difference of 36.3%.
Receiving Food Stamps Correlation Summary
| Measurement | Panamanian | Immigrants from Denmark |
| Minimum | 0.40% | 0.68% |
| Maximum | 43.5% | 15.0% |
| Range | 43.1% | 14.3% |
| Mean | 12.0% | 7.4% |
| Median | 11.7% | 7.3% |
| Interquartile 25% (IQ1) | 6.6% | 4.8% |
| Interquartile 75% (IQ3) | 14.3% | 9.7% |
| Interquartile Range (IQR) | 7.6% | 4.8% |
| Standard Deviation (Sample) | 8.0% | 3.4% |
| Standard Deviation (Population) | 7.9% | 3.3% |
Similar Demographics by Receiving Food Stamps
Demographics Similar to Panamanians by Receiving Food Stamps
In terms of receiving food stamps, the demographic groups most similar to Panamanians are Nigerian (13.1%, a difference of 0.010%), Ottawa (13.1%, a difference of 0.010%), Chickasaw (13.1%, a difference of 0.050%), Puget Sound Salish (13.1%, a difference of 0.060%), and Immigrants from Nigeria (13.1%, a difference of 0.10%).
| Demographics | Rating | Rank | Receiving Food Stamps |
| Bermudans | 4.8 /100 | #221 | Tragic 13.0% |
| Immigrants | Immigrants | 4.4 /100 | #222 | Tragic 13.0% |
| Immigrants | Albania | 4.4 /100 | #223 | Tragic 13.0% |
| Immigrants | Armenia | 4.3 /100 | #224 | Tragic 13.0% |
| Fijians | 4.3 /100 | #225 | Tragic 13.0% |
| Chickasaw | 3.6 /100 | #226 | Tragic 13.1% |
| Nigerians | 3.5 /100 | #227 | Tragic 13.1% |
| Panamanians | 3.5 /100 | #228 | Tragic 13.1% |
| Ottawa | 3.5 /100 | #229 | Tragic 13.1% |
| Puget Sound Salish | 3.4 /100 | #230 | Tragic 13.1% |
| Immigrants | Nigeria | 3.4 /100 | #231 | Tragic 13.1% |
| Salvadorans | 2.7 /100 | #232 | Tragic 13.2% |
| Cherokee | 2.5 /100 | #233 | Tragic 13.2% |
| Comanche | 2.4 /100 | #234 | Tragic 13.3% |
| Immigrants | Zaire | 1.9 /100 | #235 | Tragic 13.4% |
Demographics Similar to Immigrants from Denmark by Receiving Food Stamps
In terms of receiving food stamps, the demographic groups most similar to Immigrants from Denmark are Immigrants from Belgium (9.6%, a difference of 0.030%), Australian (9.6%, a difference of 0.11%), Indian (Asian) (9.6%, a difference of 0.17%), Croatian (9.6%, a difference of 0.23%), and Russian (9.6%, a difference of 0.28%).
| Demographics | Rating | Rank | Receiving Food Stamps |
| Europeans | 99.6 /100 | #37 | Exceptional 9.5% |
| Immigrants | Sri Lanka | 99.5 /100 | #38 | Exceptional 9.5% |
| Immigrants | Bolivia | 99.5 /100 | #39 | Exceptional 9.5% |
| Immigrants | Netherlands | 99.5 /100 | #40 | Exceptional 9.5% |
| Cambodians | 99.5 /100 | #41 | Exceptional 9.5% |
| Immigrants | China | 99.5 /100 | #42 | Exceptional 9.6% |
| Croatians | 99.5 /100 | #43 | Exceptional 9.6% |
| Immigrants | Denmark | 99.4 /100 | #44 | Exceptional 9.6% |
| Immigrants | Belgium | 99.4 /100 | #45 | Exceptional 9.6% |
| Australians | 99.4 /100 | #46 | Exceptional 9.6% |
| Indians (Asian) | 99.4 /100 | #47 | Exceptional 9.6% |
| Russians | 99.4 /100 | #48 | Exceptional 9.6% |
| Immigrants | Czechoslovakia | 99.4 /100 | #49 | Exceptional 9.6% |
| Lithuanians | 99.4 /100 | #50 | Exceptional 9.7% |
| Asians | 99.3 /100 | #51 | Exceptional 9.7% |