Panamanian vs Immigrants from Cambodia Receiving Food Stamps
COMPARE
Panamanian
Immigrants from Cambodia
Receiving Food Stamps
Receiving Food Stamps Comparison
Panamanians
Immigrants from Cambodia
13.1%
RECEIVING FOOD STAMPS
3.5/ 100
METRIC RATING
228th/ 347
METRIC RANK
13.9%
RECEIVING FOOD STAMPS
0.5/ 100
METRIC RATING
250th/ 347
METRIC RANK
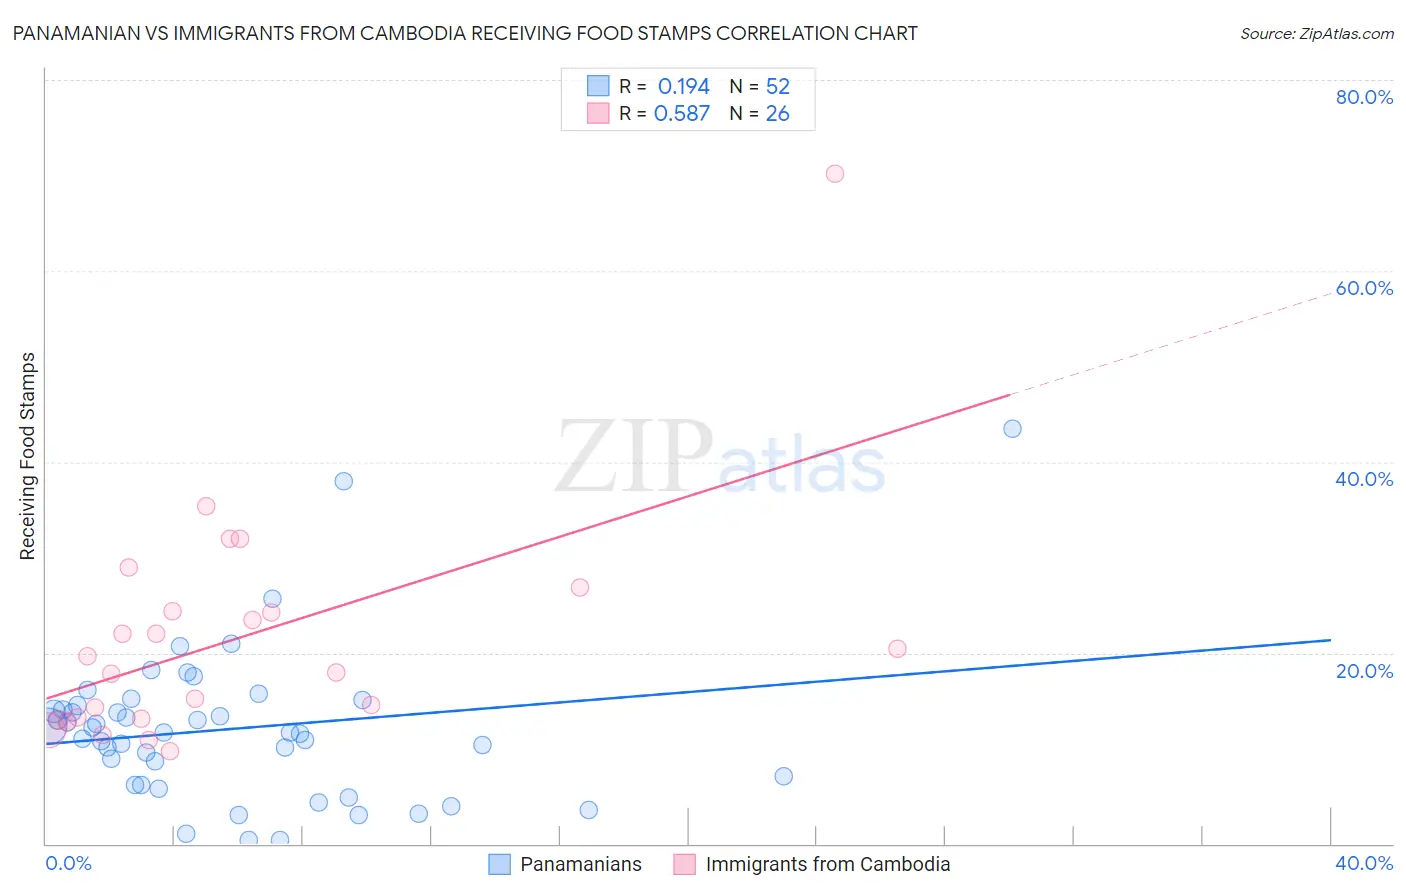
Panamanian vs Immigrants from Cambodia Receiving Food Stamps Correlation Chart
The statistical analysis conducted on geographies consisting of 280,789,065 people shows a poor positive correlation between the proportion of Panamanians and percentage of population receiving government assistance and/or food stamps in the United States with a correlation coefficient (R) of 0.194 and weighted average of 13.1%. Similarly, the statistical analysis conducted on geographies consisting of 205,011,401 people shows a substantial positive correlation between the proportion of Immigrants from Cambodia and percentage of population receiving government assistance and/or food stamps in the United States with a correlation coefficient (R) of 0.587 and weighted average of 13.9%, a difference of 5.9%.
Receiving Food Stamps Correlation Summary
| Measurement | Panamanian | Immigrants from Cambodia |
| Minimum | 0.40% | 9.7% |
| Maximum | 43.5% | 70.2% |
| Range | 43.1% | 60.5% |
| Mean | 12.0% | 21.4% |
| Median | 11.7% | 18.8% |
| Interquartile 25% (IQ1) | 6.6% | 13.1% |
| Interquartile 75% (IQ3) | 14.3% | 24.3% |
| Interquartile Range (IQR) | 7.6% | 11.2% |
| Standard Deviation (Sample) | 8.0% | 12.3% |
| Standard Deviation (Population) | 7.9% | 12.1% |
Similar Demographics by Receiving Food Stamps
Demographics Similar to Panamanians by Receiving Food Stamps
In terms of receiving food stamps, the demographic groups most similar to Panamanians are Nigerian (13.1%, a difference of 0.010%), Ottawa (13.1%, a difference of 0.010%), Chickasaw (13.1%, a difference of 0.050%), Puget Sound Salish (13.1%, a difference of 0.060%), and Immigrants from Nigeria (13.1%, a difference of 0.10%).
| Demographics | Rating | Rank | Receiving Food Stamps |
| Bermudans | 4.8 /100 | #221 | Tragic 13.0% |
| Immigrants | Immigrants | 4.4 /100 | #222 | Tragic 13.0% |
| Immigrants | Albania | 4.4 /100 | #223 | Tragic 13.0% |
| Immigrants | Armenia | 4.3 /100 | #224 | Tragic 13.0% |
| Fijians | 4.3 /100 | #225 | Tragic 13.0% |
| Chickasaw | 3.6 /100 | #226 | Tragic 13.1% |
| Nigerians | 3.5 /100 | #227 | Tragic 13.1% |
| Panamanians | 3.5 /100 | #228 | Tragic 13.1% |
| Ottawa | 3.5 /100 | #229 | Tragic 13.1% |
| Puget Sound Salish | 3.4 /100 | #230 | Tragic 13.1% |
| Immigrants | Nigeria | 3.4 /100 | #231 | Tragic 13.1% |
| Salvadorans | 2.7 /100 | #232 | Tragic 13.2% |
| Cherokee | 2.5 /100 | #233 | Tragic 13.2% |
| Comanche | 2.4 /100 | #234 | Tragic 13.3% |
| Immigrants | Zaire | 1.9 /100 | #235 | Tragic 13.4% |
Demographics Similar to Immigrants from Cambodia by Receiving Food Stamps
In terms of receiving food stamps, the demographic groups most similar to Immigrants from Cambodia are Yaqui (13.9%, a difference of 0.070%), Indonesian (13.9%, a difference of 0.17%), Ghanaian (14.0%, a difference of 0.52%), Immigrants from Laos (13.8%, a difference of 0.80%), and Spanish American (14.0%, a difference of 0.89%).
| Demographics | Rating | Rank | Receiving Food Stamps |
| Somalis | 0.9 /100 | #243 | Tragic 13.7% |
| Cajuns | 0.9 /100 | #244 | Tragic 13.7% |
| Immigrants | Somalia | 0.9 /100 | #245 | Tragic 13.7% |
| Cree | 0.8 /100 | #246 | Tragic 13.7% |
| Mexican American Indians | 0.7 /100 | #247 | Tragic 13.8% |
| Immigrants | Laos | 0.7 /100 | #248 | Tragic 13.8% |
| Indonesians | 0.6 /100 | #249 | Tragic 13.9% |
| Immigrants | Cambodia | 0.5 /100 | #250 | Tragic 13.9% |
| Yaqui | 0.5 /100 | #251 | Tragic 13.9% |
| Ghanaians | 0.5 /100 | #252 | Tragic 14.0% |
| Spanish Americans | 0.4 /100 | #253 | Tragic 14.0% |
| Marshallese | 0.3 /100 | #254 | Tragic 14.1% |
| Sub-Saharan Africans | 0.3 /100 | #255 | Tragic 14.1% |
| Japanese | 0.3 /100 | #256 | Tragic 14.1% |
| Arapaho | 0.3 /100 | #257 | Tragic 14.1% |