Scandinavian vs Native Hawaiian Receiving Food Stamps
COMPARE
Scandinavian
Native Hawaiian
Receiving Food Stamps
Receiving Food Stamps Comparison
Scandinavians
Native Hawaiians
9.7%
RECEIVING FOOD STAMPS
99.2/ 100
METRIC RATING
58th/ 347
METRIC RANK
12.8%
RECEIVING FOOD STAMPS
6.7/ 100
METRIC RATING
215th/ 347
METRIC RANK
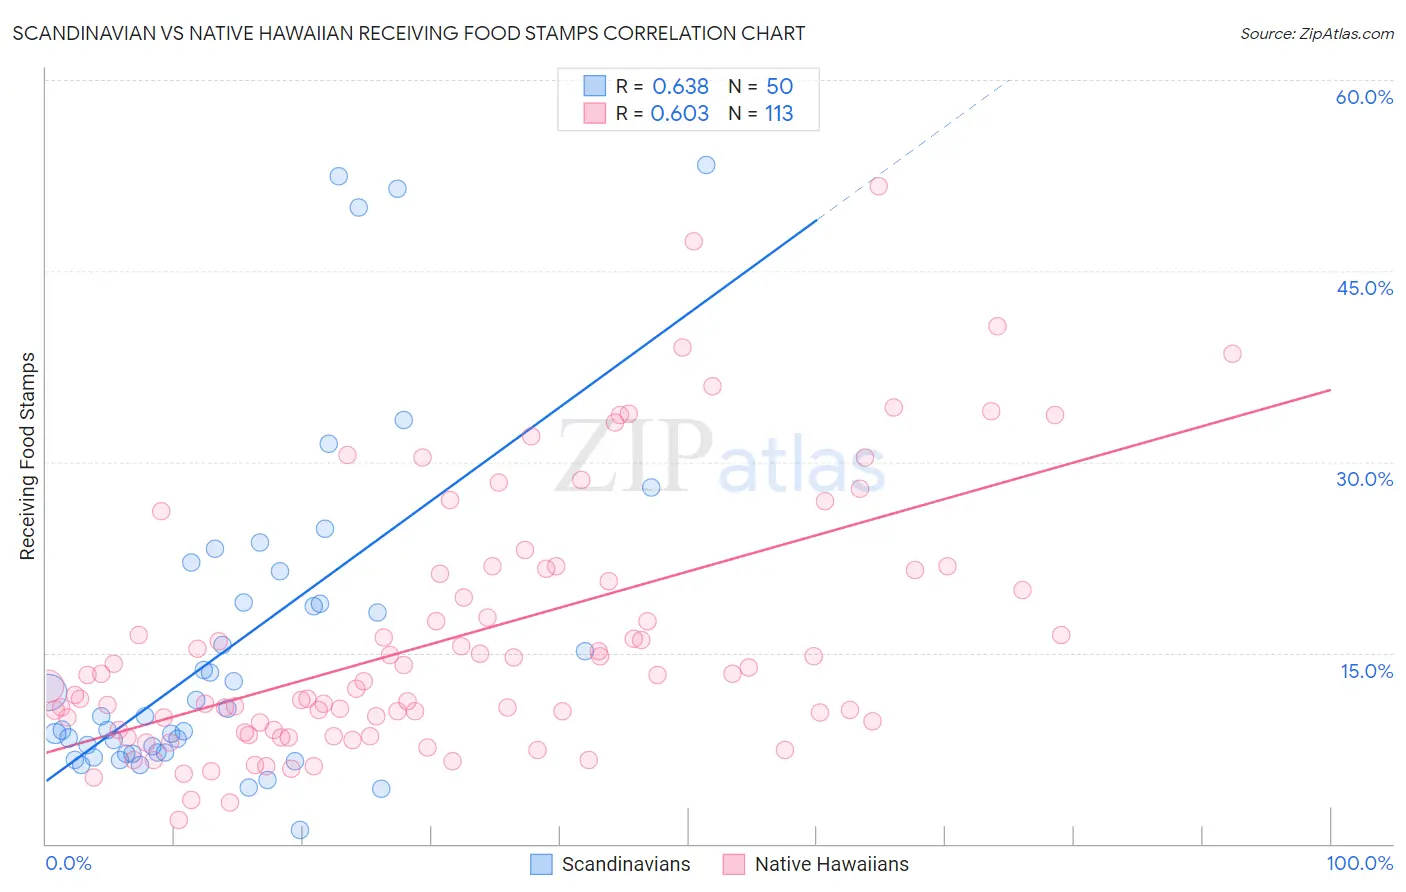
Scandinavian vs Native Hawaiian Receiving Food Stamps Correlation Chart
The statistical analysis conducted on geographies consisting of 470,816,598 people shows a significant positive correlation between the proportion of Scandinavians and percentage of population receiving government assistance and/or food stamps in the United States with a correlation coefficient (R) of 0.638 and weighted average of 9.7%. Similarly, the statistical analysis conducted on geographies consisting of 331,508,254 people shows a significant positive correlation between the proportion of Native Hawaiians and percentage of population receiving government assistance and/or food stamps in the United States with a correlation coefficient (R) of 0.603 and weighted average of 12.8%, a difference of 31.8%.
Receiving Food Stamps Correlation Summary
| Measurement | Scandinavian | Native Hawaiian |
| Minimum | 1.1% | 1.9% |
| Maximum | 53.3% | 51.7% |
| Range | 52.2% | 49.8% |
| Mean | 15.6% | 16.1% |
| Median | 10.0% | 12.8% |
| Interquartile 25% (IQ1) | 7.1% | 9.0% |
| Interquartile 75% (IQ3) | 18.9% | 21.4% |
| Interquartile Range (IQR) | 11.8% | 12.4% |
| Standard Deviation (Sample) | 13.0% | 10.1% |
| Standard Deviation (Population) | 12.9% | 10.1% |
Similar Demographics by Receiving Food Stamps
Demographics Similar to Scandinavians by Receiving Food Stamps
In terms of receiving food stamps, the demographic groups most similar to Scandinavians are British (9.7%, a difference of 0.030%), Greek (9.7%, a difference of 0.060%), German (9.7%, a difference of 0.13%), Immigrants from Canada (9.7%, a difference of 0.17%), and English (9.8%, a difference of 0.27%).
| Demographics | Rating | Rank | Receiving Food Stamps |
| Asians | 99.3 /100 | #51 | Exceptional 9.7% |
| Immigrants | South Africa | 99.3 /100 | #52 | Exceptional 9.7% |
| Tongans | 99.3 /100 | #53 | Exceptional 9.7% |
| Swiss | 99.3 /100 | #54 | Exceptional 9.7% |
| Immigrants | Switzerland | 99.3 /100 | #55 | Exceptional 9.7% |
| Immigrants | Canada | 99.3 /100 | #56 | Exceptional 9.7% |
| Greeks | 99.3 /100 | #57 | Exceptional 9.7% |
| Scandinavians | 99.2 /100 | #58 | Exceptional 9.7% |
| British | 99.2 /100 | #59 | Exceptional 9.7% |
| Germans | 99.2 /100 | #60 | Exceptional 9.7% |
| English | 99.2 /100 | #61 | Exceptional 9.8% |
| Immigrants | Bulgaria | 99.2 /100 | #62 | Exceptional 9.8% |
| Chinese | 99.2 /100 | #63 | Exceptional 9.8% |
| Immigrants | North America | 99.2 /100 | #64 | Exceptional 9.8% |
| Immigrants | Turkey | 99.1 /100 | #65 | Exceptional 9.8% |
Demographics Similar to Native Hawaiians by Receiving Food Stamps
In terms of receiving food stamps, the demographic groups most similar to Native Hawaiians are Immigrants from South America (12.8%, a difference of 0.11%), Immigrants from Burma/Myanmar (12.9%, a difference of 0.36%), Immigrants from Africa (12.8%, a difference of 0.44%), Moroccan (12.8%, a difference of 0.47%), and Hawaiian (12.9%, a difference of 0.73%).
| Demographics | Rating | Rank | Receiving Food Stamps |
| Potawatomi | 14.6 /100 | #208 | Poor 12.5% |
| Immigrants | Sierra Leone | 12.9 /100 | #209 | Poor 12.5% |
| Immigrants | Uruguay | 12.8 /100 | #210 | Poor 12.5% |
| Colombians | 10.2 /100 | #211 | Poor 12.6% |
| Malaysians | 8.5 /100 | #212 | Tragic 12.7% |
| Moroccans | 7.6 /100 | #213 | Tragic 12.8% |
| Immigrants | Africa | 7.6 /100 | #214 | Tragic 12.8% |
| Native Hawaiians | 6.7 /100 | #215 | Tragic 12.8% |
| Immigrants | South America | 6.5 /100 | #216 | Tragic 12.8% |
| Immigrants | Burma/Myanmar | 6.0 /100 | #217 | Tragic 12.9% |
| Hawaiians | 5.4 /100 | #218 | Tragic 12.9% |
| Immigrants | Middle Africa | 5.4 /100 | #219 | Tragic 12.9% |
| Immigrants | Colombia | 5.3 /100 | #220 | Tragic 12.9% |
| Bermudans | 4.8 /100 | #221 | Tragic 13.0% |
| Immigrants | Immigrants | 4.4 /100 | #222 | Tragic 13.0% |