Jordanian vs Cheyenne Married-Couple Family Poverty
COMPARE
Jordanian
Cheyenne
Married-Couple Family Poverty
Married-Couple Family Poverty Comparison
Jordanians
Cheyenne
4.8%
MARRIED-COUPLE FAMILY POVERTY
93.1/ 100
METRIC RATING
123rd/ 347
METRIC RANK
9.4%
MARRIED-COUPLE FAMILY POVERTY
0.0/ 100
METRIC RATING
338th/ 347
METRIC RANK
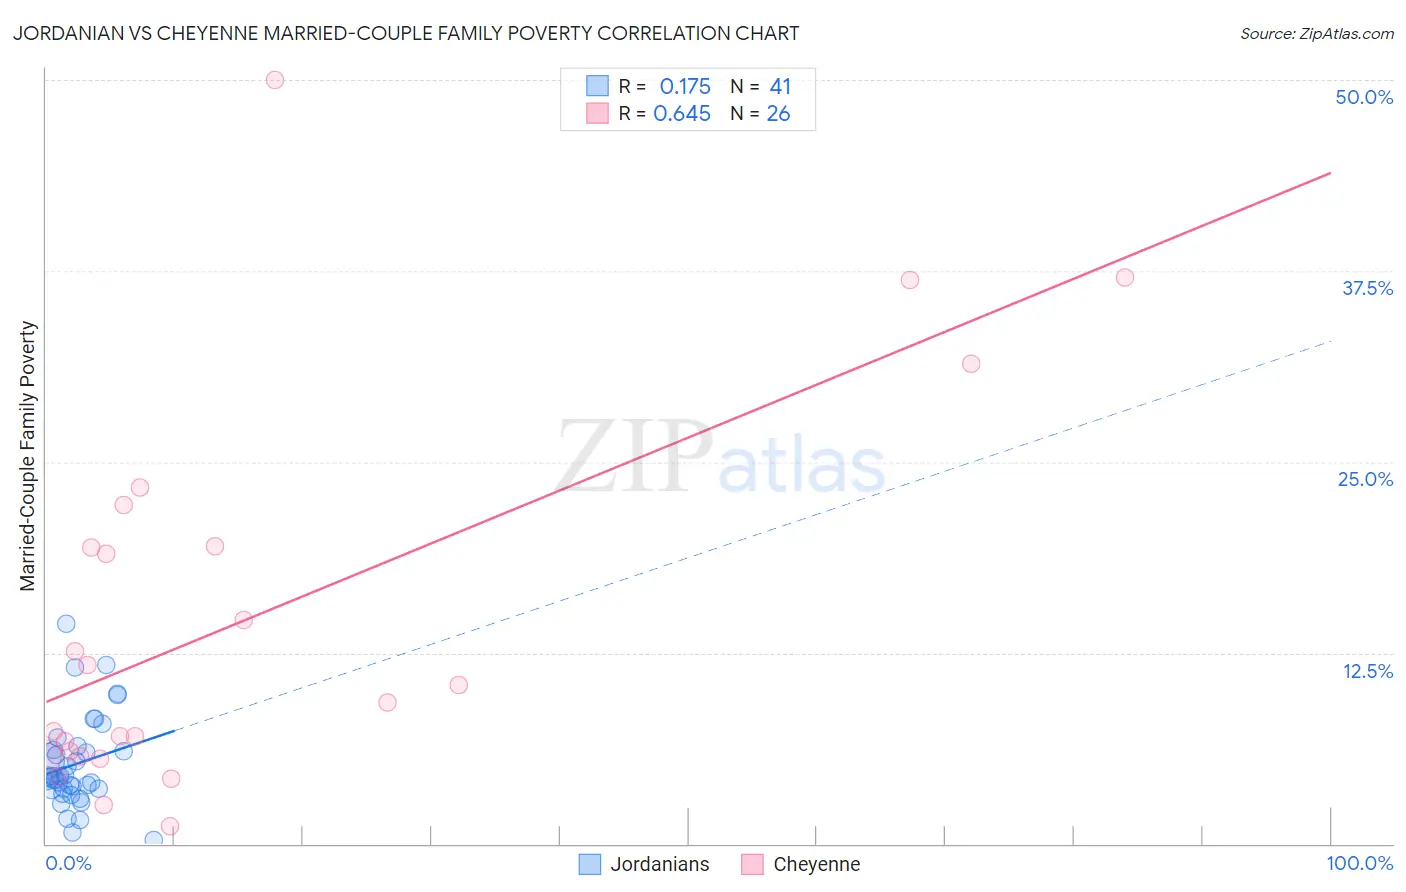
Jordanian vs Cheyenne Married-Couple Family Poverty Correlation Chart
The statistical analysis conducted on geographies consisting of 165,961,461 people shows a poor positive correlation between the proportion of Jordanians and poverty level among married-couple families in the United States with a correlation coefficient (R) of 0.175 and weighted average of 4.8%. Similarly, the statistical analysis conducted on geographies consisting of 80,557,927 people shows a significant positive correlation between the proportion of Cheyenne and poverty level among married-couple families in the United States with a correlation coefficient (R) of 0.645 and weighted average of 9.4%, a difference of 95.6%.
Married-Couple Family Poverty Correlation Summary
| Measurement | Jordanian | Cheyenne |
| Minimum | 0.23% | 1.1% |
| Maximum | 14.4% | 50.0% |
| Range | 14.1% | 48.9% |
| Mean | 5.2% | 14.7% |
| Median | 4.4% | 9.8% |
| Interquartile 25% (IQ1) | 3.6% | 5.8% |
| Interquartile 75% (IQ3) | 6.3% | 19.4% |
| Interquartile Range (IQR) | 2.7% | 13.7% |
| Standard Deviation (Sample) | 3.0% | 12.5% |
| Standard Deviation (Population) | 3.0% | 12.2% |
Similar Demographics by Married-Couple Family Poverty
Demographics Similar to Jordanians by Married-Couple Family Poverty
In terms of married-couple family poverty, the demographic groups most similar to Jordanians are White/Caucasian (4.8%, a difference of 0.020%), Indian (Asian) (4.8%, a difference of 0.060%), Immigrants from Southern Europe (4.8%, a difference of 0.16%), Romanian (4.8%, a difference of 0.27%), and Immigrants from Bosnia and Herzegovina (4.8%, a difference of 0.29%).
| Demographics | Rating | Rank | Married-Couple Family Poverty |
| Celtics | 94.8 /100 | #116 | Exceptional 4.8% |
| Kenyans | 94.7 /100 | #117 | Exceptional 4.8% |
| Immigrants | Philippines | 94.6 /100 | #118 | Exceptional 4.8% |
| Immigrants | Eastern Asia | 94.0 /100 | #119 | Exceptional 4.8% |
| Immigrants | Southern Europe | 93.4 /100 | #120 | Exceptional 4.8% |
| Indians (Asian) | 93.2 /100 | #121 | Exceptional 4.8% |
| Whites/Caucasians | 93.1 /100 | #122 | Exceptional 4.8% |
| Jordanians | 93.1 /100 | #123 | Exceptional 4.8% |
| Romanians | 92.5 /100 | #124 | Exceptional 4.8% |
| Immigrants | Bosnia and Herzegovina | 92.5 /100 | #125 | Exceptional 4.8% |
| Immigrants | Asia | 92.3 /100 | #126 | Exceptional 4.8% |
| Egyptians | 92.0 /100 | #127 | Exceptional 4.8% |
| Palestinians | 91.2 /100 | #128 | Exceptional 4.9% |
| Immigrants | Pakistan | 90.7 /100 | #129 | Exceptional 4.9% |
| Soviet Union | 90.7 /100 | #130 | Exceptional 4.9% |
Demographics Similar to Cheyenne by Married-Couple Family Poverty
In terms of married-couple family poverty, the demographic groups most similar to Cheyenne are Crow (9.6%, a difference of 1.3%), Yuman (9.7%, a difference of 3.2%), Yakama (9.0%, a difference of 5.3%), Apache (9.0%, a difference of 5.4%), and Sioux (8.7%, a difference of 8.5%).
| Demographics | Rating | Rank | Married-Couple Family Poverty |
| Central American Indians | 0.0 /100 | #331 | Tragic 8.3% |
| Dominicans | 0.0 /100 | #332 | Tragic 8.3% |
| Lumbee | 0.0 /100 | #333 | Tragic 8.3% |
| Immigrants | Dominican Republic | 0.0 /100 | #334 | Tragic 8.4% |
| Sioux | 0.0 /100 | #335 | Tragic 8.7% |
| Apache | 0.0 /100 | #336 | Tragic 9.0% |
| Yakama | 0.0 /100 | #337 | Tragic 9.0% |
| Cheyenne | 0.0 /100 | #338 | Tragic 9.4% |
| Crow | 0.0 /100 | #339 | Tragic 9.6% |
| Yuman | 0.0 /100 | #340 | Tragic 9.7% |
| Pueblo | 0.0 /100 | #341 | Tragic 11.1% |
| Tohono O'odham | 0.0 /100 | #342 | Tragic 11.2% |
| Pima | 0.0 /100 | #343 | Tragic 11.4% |
| Navajo | 0.0 /100 | #344 | Tragic 11.9% |
| Puerto Ricans | 0.0 /100 | #345 | Tragic 12.6% |