Italian vs Immigrants from Hungary Single Father Poverty
COMPARE
Italian
Immigrants from Hungary
Single Father Poverty
Single Father Poverty Comparison
Italians
Immigrants from Hungary
17.5%
SINGLE FATHER POVERTY
0.1/ 100
METRIC RATING
273rd/ 347
METRIC RANK
16.1%
SINGLE FATHER POVERTY
78.3/ 100
METRIC RATING
146th/ 347
METRIC RANK
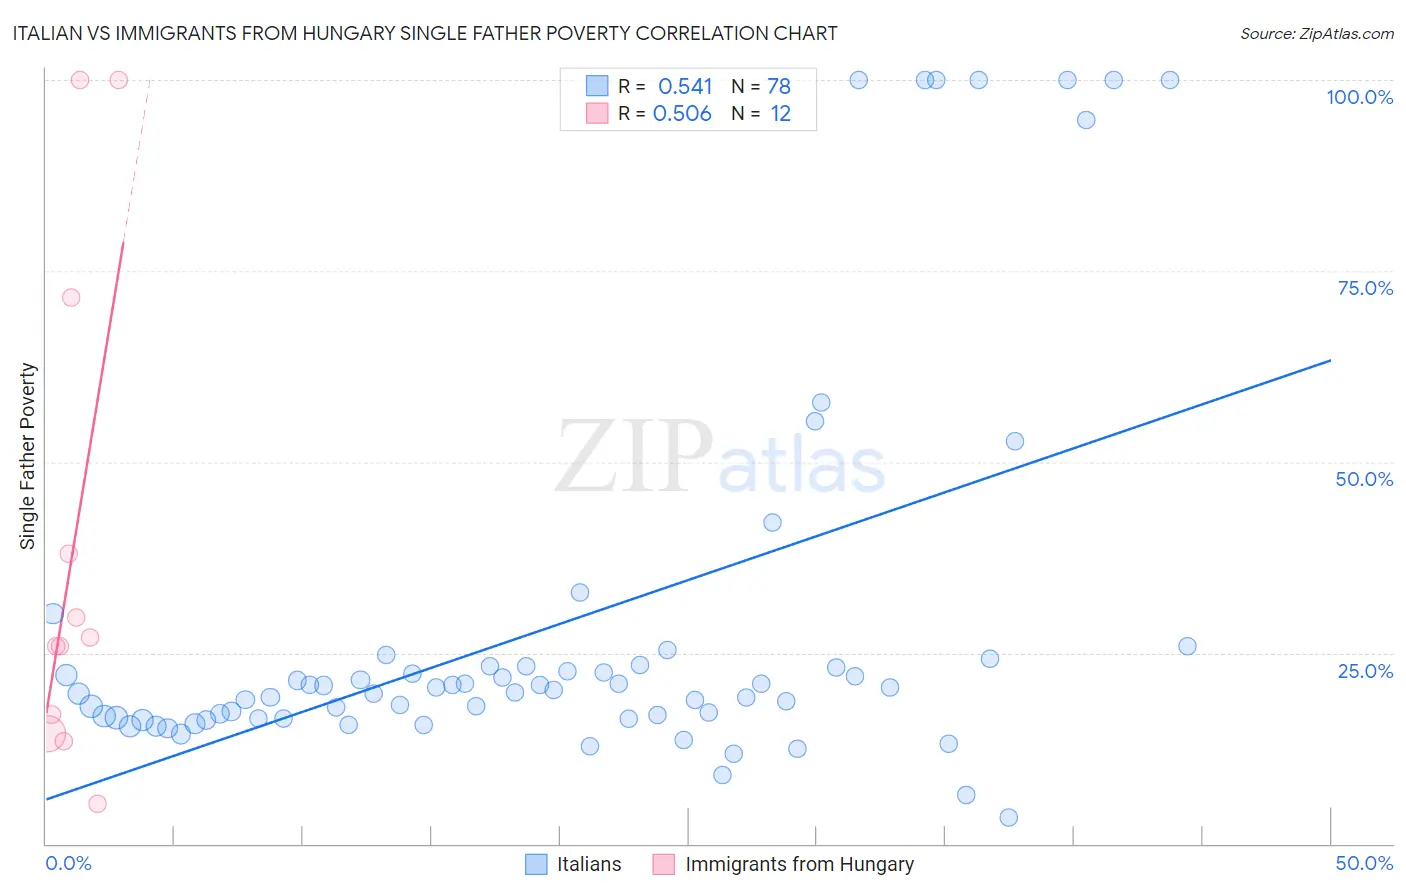
Italian vs Immigrants from Hungary Single Father Poverty Correlation Chart
The statistical analysis conducted on geographies consisting of 411,059,801 people shows a substantial positive correlation between the proportion of Italians and poverty level among single fathers in the United States with a correlation coefficient (R) of 0.541 and weighted average of 17.5%. Similarly, the statistical analysis conducted on geographies consisting of 163,698,265 people shows a substantial positive correlation between the proportion of Immigrants from Hungary and poverty level among single fathers in the United States with a correlation coefficient (R) of 0.506 and weighted average of 16.1%, a difference of 9.2%.
Single Father Poverty Correlation Summary
| Measurement | Italian | Immigrants from Hungary |
| Minimum | 3.4% | 5.2% |
| Maximum | 100.0% | 100.0% |
| Range | 96.6% | 94.8% |
| Mean | 28.7% | 39.0% |
| Median | 20.3% | 26.4% |
| Interquartile 25% (IQ1) | 16.4% | 15.7% |
| Interquartile 75% (IQ3) | 23.3% | 54.8% |
| Interquartile Range (IQR) | 6.9% | 39.1% |
| Standard Deviation (Sample) | 25.6% | 33.0% |
| Standard Deviation (Population) | 25.4% | 31.6% |
Similar Demographics by Single Father Poverty
Demographics Similar to Italians by Single Father Poverty
In terms of single father poverty, the demographic groups most similar to Italians are Barbadian (17.5%, a difference of 0.28%), French American Indian (17.4%, a difference of 0.63%), Macedonian (17.7%, a difference of 0.66%), British West Indian (17.7%, a difference of 0.72%), and Indonesian (17.4%, a difference of 0.77%).
| Demographics | Rating | Rank | Single Father Poverty |
| Jamaicans | 0.3 /100 | #266 | Tragic 17.3% |
| Haitians | 0.3 /100 | #267 | Tragic 17.3% |
| Immigrants | Caribbean | 0.3 /100 | #268 | Tragic 17.4% |
| Slavs | 0.3 /100 | #269 | Tragic 17.4% |
| Indonesians | 0.2 /100 | #270 | Tragic 17.4% |
| French American Indians | 0.2 /100 | #271 | Tragic 17.4% |
| Barbadians | 0.1 /100 | #272 | Tragic 17.5% |
| Italians | 0.1 /100 | #273 | Tragic 17.5% |
| Macedonians | 0.1 /100 | #274 | Tragic 17.7% |
| British West Indians | 0.0 /100 | #275 | Tragic 17.7% |
| German Russians | 0.0 /100 | #276 | Tragic 17.7% |
| Lebanese | 0.0 /100 | #277 | Tragic 17.7% |
| Germans | 0.0 /100 | #278 | Tragic 17.7% |
| Iroquois | 0.0 /100 | #279 | Tragic 17.7% |
| Scottish | 0.0 /100 | #280 | Tragic 17.7% |
Demographics Similar to Immigrants from Hungary by Single Father Poverty
In terms of single father poverty, the demographic groups most similar to Immigrants from Hungary are Colombian (16.1%, a difference of 0.080%), Nigerian (16.1%, a difference of 0.10%), Immigrants from Western Asia (16.0%, a difference of 0.16%), South African (16.1%, a difference of 0.20%), and Immigrants from Kuwait (16.0%, a difference of 0.22%).
| Demographics | Rating | Rank | Single Father Poverty |
| South Americans | 85.9 /100 | #139 | Excellent 16.0% |
| Immigrants | Netherlands | 85.3 /100 | #140 | Excellent 16.0% |
| Liberians | 83.3 /100 | #141 | Excellent 16.0% |
| Immigrants | Mexico | 83.3 /100 | #142 | Excellent 16.0% |
| Immigrants | Central America | 83.1 /100 | #143 | Excellent 16.0% |
| Immigrants | Kuwait | 81.4 /100 | #144 | Excellent 16.0% |
| Immigrants | Western Asia | 80.7 /100 | #145 | Excellent 16.0% |
| Immigrants | Hungary | 78.3 /100 | #146 | Good 16.1% |
| Colombians | 77.1 /100 | #147 | Good 16.1% |
| Nigerians | 76.8 /100 | #148 | Good 16.1% |
| South Africans | 75.1 /100 | #149 | Good 16.1% |
| Jordanians | 74.2 /100 | #150 | Good 16.1% |
| Immigrants | France | 73.1 /100 | #151 | Good 16.1% |
| Immigrants | Zimbabwe | 72.1 /100 | #152 | Good 16.1% |
| Immigrants | Israel | 72.0 /100 | #153 | Good 16.1% |