Italian vs Immigrants from Hungary Wage/Income Gap
COMPARE
Italian
Immigrants from Hungary
Wage/Income Gap
Wage/Income Gap Comparison
Italians
Immigrants from Hungary
28.1%
WAGE/INCOME GAP
0.4/ 100
METRIC RATING
285th/ 347
METRIC RANK
27.0%
WAGE/INCOME GAP
4.8/ 100
METRIC RATING
235th/ 347
METRIC RANK
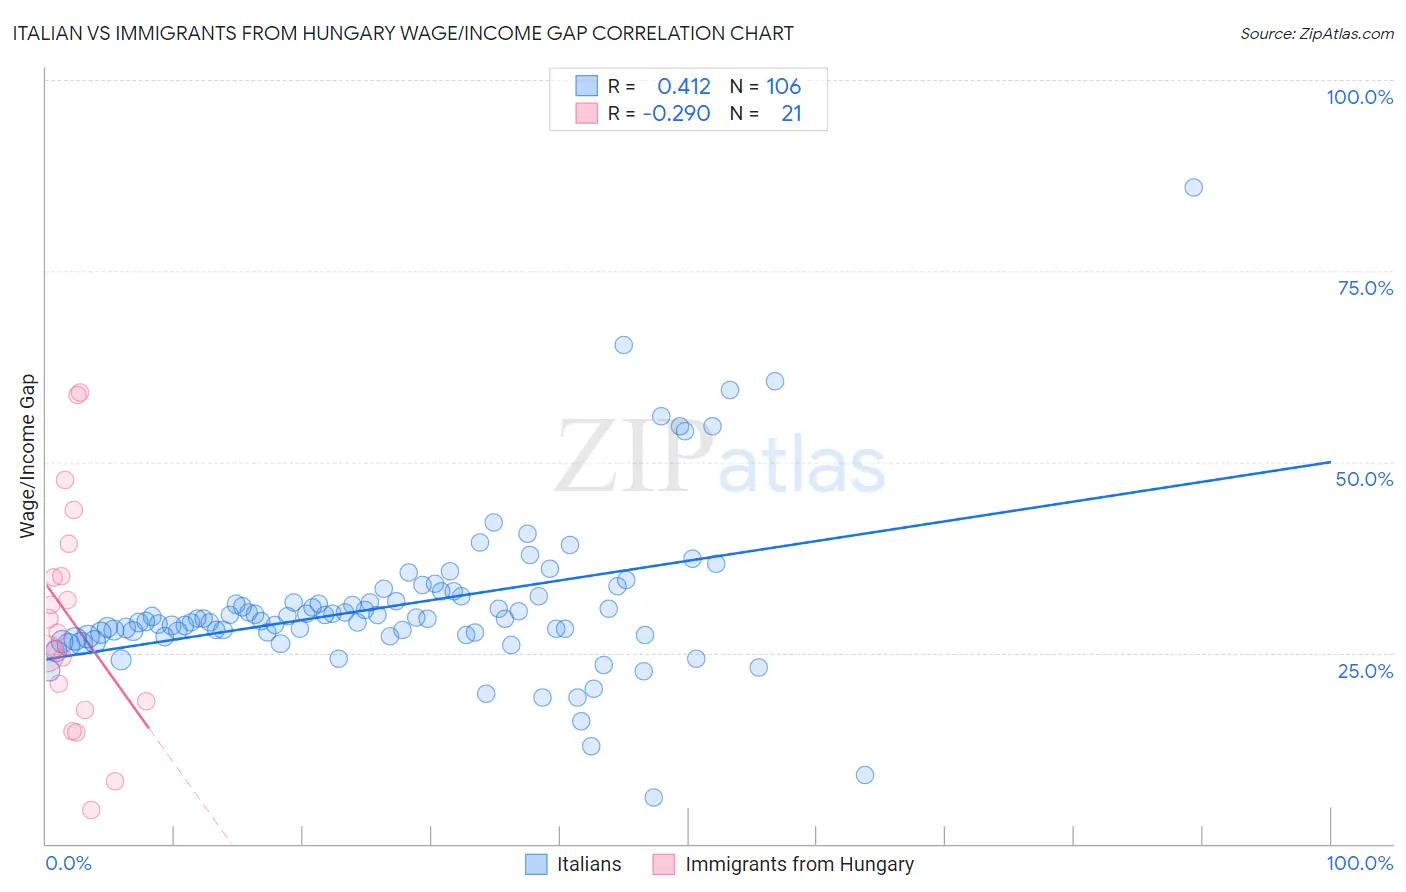
Italian vs Immigrants from Hungary Wage/Income Gap Correlation Chart
The statistical analysis conducted on geographies consisting of 571,985,194 people shows a moderate positive correlation between the proportion of Italians and wage/income gap percentage in the United States with a correlation coefficient (R) of 0.412 and weighted average of 28.1%. Similarly, the statistical analysis conducted on geographies consisting of 195,626,970 people shows a weak negative correlation between the proportion of Immigrants from Hungary and wage/income gap percentage in the United States with a correlation coefficient (R) of -0.290 and weighted average of 27.0%, a difference of 4.0%.
Wage/Income Gap Correlation Summary
| Measurement | Italian | Immigrants from Hungary |
| Minimum | 6.1% | 4.4% |
| Maximum | 86.0% | 59.1% |
| Range | 79.9% | 54.6% |
| Mean | 31.2% | 29.2% |
| Median | 29.5% | 27.6% |
| Interquartile 25% (IQ1) | 27.3% | 18.1% |
| Interquartile 75% (IQ3) | 32.4% | 37.2% |
| Interquartile Range (IQR) | 5.1% | 19.1% |
| Standard Deviation (Sample) | 10.6% | 14.7% |
| Standard Deviation (Population) | 10.5% | 14.4% |
Similar Demographics by Wage/Income Gap
Demographics Similar to Italians by Wage/Income Gap
In terms of wage/income gap, the demographic groups most similar to Italians are Immigrants from Austria (28.1%, a difference of 0.030%), Okinawan (28.1%, a difference of 0.070%), Choctaw (28.1%, a difference of 0.10%), Immigrants from Sweden (28.1%, a difference of 0.13%), and French Canadian (28.1%, a difference of 0.14%).
| Demographics | Rating | Rank | Wage/Income Gap |
| Immigrants | England | 0.6 /100 | #278 | Tragic 27.9% |
| Romanians | 0.5 /100 | #279 | Tragic 28.0% |
| Russians | 0.5 /100 | #280 | Tragic 28.0% |
| Burmese | 0.5 /100 | #281 | Tragic 28.0% |
| South Africans | 0.5 /100 | #282 | Tragic 28.0% |
| French Canadians | 0.4 /100 | #283 | Tragic 28.1% |
| Immigrants | Sweden | 0.4 /100 | #284 | Tragic 28.1% |
| Italians | 0.4 /100 | #285 | Tragic 28.1% |
| Immigrants | Austria | 0.4 /100 | #286 | Tragic 28.1% |
| Okinawans | 0.4 /100 | #287 | Tragic 28.1% |
| Choctaw | 0.4 /100 | #288 | Tragic 28.1% |
| Canadians | 0.3 /100 | #289 | Tragic 28.1% |
| Australians | 0.3 /100 | #290 | Tragic 28.2% |
| Czechoslovakians | 0.3 /100 | #291 | Tragic 28.2% |
| Immigrants | Australia | 0.3 /100 | #292 | Tragic 28.2% |
Demographics Similar to Immigrants from Hungary by Wage/Income Gap
In terms of wage/income gap, the demographic groups most similar to Immigrants from Hungary are Immigrants from Pakistan (27.0%, a difference of 0.010%), Immigrants from Romania (27.0%, a difference of 0.020%), Immigrants from Brazil (27.0%, a difference of 0.060%), Argentinean (27.0%, a difference of 0.12%), and Bhutanese (27.0%, a difference of 0.15%).
| Demographics | Rating | Rank | Wage/Income Gap |
| Immigrants | Turkey | 5.6 /100 | #228 | Tragic 27.0% |
| Immigrants | Asia | 5.5 /100 | #229 | Tragic 27.0% |
| Ottawa | 5.3 /100 | #230 | Tragic 27.0% |
| Bhutanese | 5.3 /100 | #231 | Tragic 27.0% |
| Argentineans | 5.2 /100 | #232 | Tragic 27.0% |
| Immigrants | Brazil | 5.0 /100 | #233 | Tragic 27.0% |
| Immigrants | Pakistan | 4.9 /100 | #234 | Tragic 27.0% |
| Immigrants | Hungary | 4.8 /100 | #235 | Tragic 27.0% |
| Immigrants | Romania | 4.8 /100 | #236 | Tragic 27.0% |
| Immigrants | Eastern Asia | 4.4 /100 | #237 | Tragic 27.1% |
| Osage | 4.4 /100 | #238 | Tragic 27.1% |
| Estonians | 4.3 /100 | #239 | Tragic 27.1% |
| Immigrants | Europe | 3.8 /100 | #240 | Tragic 27.1% |
| Creek | 3.8 /100 | #241 | Tragic 27.1% |
| Immigrants | Sri Lanka | 3.7 /100 | #242 | Tragic 27.1% |