Italian vs Costa Rican Single Father Poverty
COMPARE
Italian
Costa Rican
Single Father Poverty
Single Father Poverty Comparison
Italians
Costa Ricans
17.5%
SINGLE FATHER POVERTY
0.1/ 100
METRIC RATING
273rd/ 347
METRIC RANK
16.3%
SINGLE FATHER POVERTY
53.6/ 100
METRIC RATING
168th/ 347
METRIC RANK
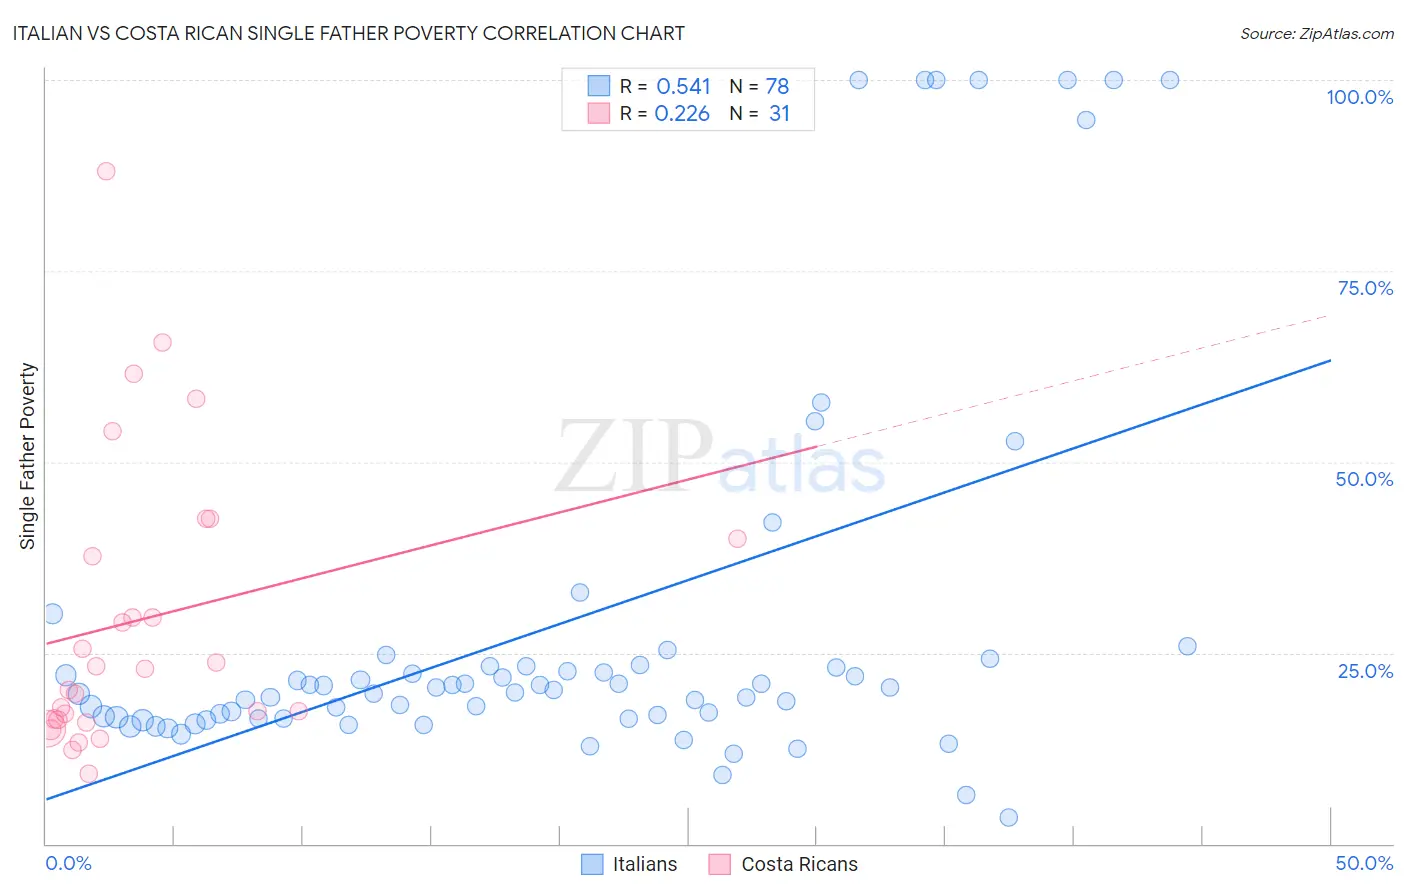
Italian vs Costa Rican Single Father Poverty Correlation Chart
The statistical analysis conducted on geographies consisting of 411,059,801 people shows a substantial positive correlation between the proportion of Italians and poverty level among single fathers in the United States with a correlation coefficient (R) of 0.541 and weighted average of 17.5%. Similarly, the statistical analysis conducted on geographies consisting of 214,282,410 people shows a weak positive correlation between the proportion of Costa Ricans and poverty level among single fathers in the United States with a correlation coefficient (R) of 0.226 and weighted average of 16.3%, a difference of 7.8%.
Single Father Poverty Correlation Summary
| Measurement | Italian | Costa Rican |
| Minimum | 3.4% | 9.2% |
| Maximum | 100.0% | 88.0% |
| Range | 96.6% | 78.8% |
| Mean | 28.7% | 29.4% |
| Median | 20.3% | 23.0% |
| Interquartile 25% (IQ1) | 16.4% | 16.2% |
| Interquartile 75% (IQ3) | 23.3% | 40.0% |
| Interquartile Range (IQR) | 6.9% | 23.8% |
| Standard Deviation (Sample) | 25.6% | 18.9% |
| Standard Deviation (Population) | 25.4% | 18.6% |
Similar Demographics by Single Father Poverty
Demographics Similar to Italians by Single Father Poverty
In terms of single father poverty, the demographic groups most similar to Italians are Barbadian (17.5%, a difference of 0.28%), French American Indian (17.4%, a difference of 0.63%), Macedonian (17.7%, a difference of 0.66%), British West Indian (17.7%, a difference of 0.72%), and Indonesian (17.4%, a difference of 0.77%).
| Demographics | Rating | Rank | Single Father Poverty |
| Jamaicans | 0.3 /100 | #266 | Tragic 17.3% |
| Haitians | 0.3 /100 | #267 | Tragic 17.3% |
| Immigrants | Caribbean | 0.3 /100 | #268 | Tragic 17.4% |
| Slavs | 0.3 /100 | #269 | Tragic 17.4% |
| Indonesians | 0.2 /100 | #270 | Tragic 17.4% |
| French American Indians | 0.2 /100 | #271 | Tragic 17.4% |
| Barbadians | 0.1 /100 | #272 | Tragic 17.5% |
| Italians | 0.1 /100 | #273 | Tragic 17.5% |
| Macedonians | 0.1 /100 | #274 | Tragic 17.7% |
| British West Indians | 0.0 /100 | #275 | Tragic 17.7% |
| German Russians | 0.0 /100 | #276 | Tragic 17.7% |
| Lebanese | 0.0 /100 | #277 | Tragic 17.7% |
| Germans | 0.0 /100 | #278 | Tragic 17.7% |
| Iroquois | 0.0 /100 | #279 | Tragic 17.7% |
| Scottish | 0.0 /100 | #280 | Tragic 17.7% |
Demographics Similar to Costa Ricans by Single Father Poverty
In terms of single father poverty, the demographic groups most similar to Costa Ricans are Yugoslavian (16.3%, a difference of 0.010%), Northern European (16.3%, a difference of 0.040%), Immigrants from Europe (16.3%, a difference of 0.050%), Scandinavian (16.3%, a difference of 0.060%), and Guyanese (16.3%, a difference of 0.070%).
| Demographics | Rating | Rank | Single Father Poverty |
| Estonians | 56.7 /100 | #161 | Average 16.2% |
| Ugandans | 55.9 /100 | #162 | Average 16.3% |
| Immigrants | Costa Rica | 55.7 /100 | #163 | Average 16.3% |
| Guyanese | 55.2 /100 | #164 | Average 16.3% |
| Immigrants | Bangladesh | 55.1 /100 | #165 | Average 16.3% |
| Immigrants | Europe | 54.8 /100 | #166 | Average 16.3% |
| Yugoslavians | 53.9 /100 | #167 | Average 16.3% |
| Costa Ricans | 53.6 /100 | #168 | Average 16.3% |
| Northern Europeans | 52.8 /100 | #169 | Average 16.3% |
| Scandinavians | 52.3 /100 | #170 | Average 16.3% |
| Immigrants | Morocco | 50.7 /100 | #171 | Average 16.3% |
| Immigrants | Sierra Leone | 50.1 /100 | #172 | Average 16.3% |
| Immigrants | St. Vincent and the Grenadines | 50.0 /100 | #173 | Average 16.3% |
| Swedes | 50.0 /100 | #174 | Average 16.3% |
| Immigrants | Ecuador | 49.7 /100 | #175 | Average 16.3% |