Italian vs Immigrants from Serbia Single Father Poverty
COMPARE
Italian
Immigrants from Serbia
Single Father Poverty
Single Father Poverty Comparison
Italians
Immigrants from Serbia
17.5%
SINGLE FATHER POVERTY
0.1/ 100
METRIC RATING
273rd/ 347
METRIC RANK
15.5%
SINGLE FATHER POVERTY
98.5/ 100
METRIC RATING
92nd/ 347
METRIC RANK
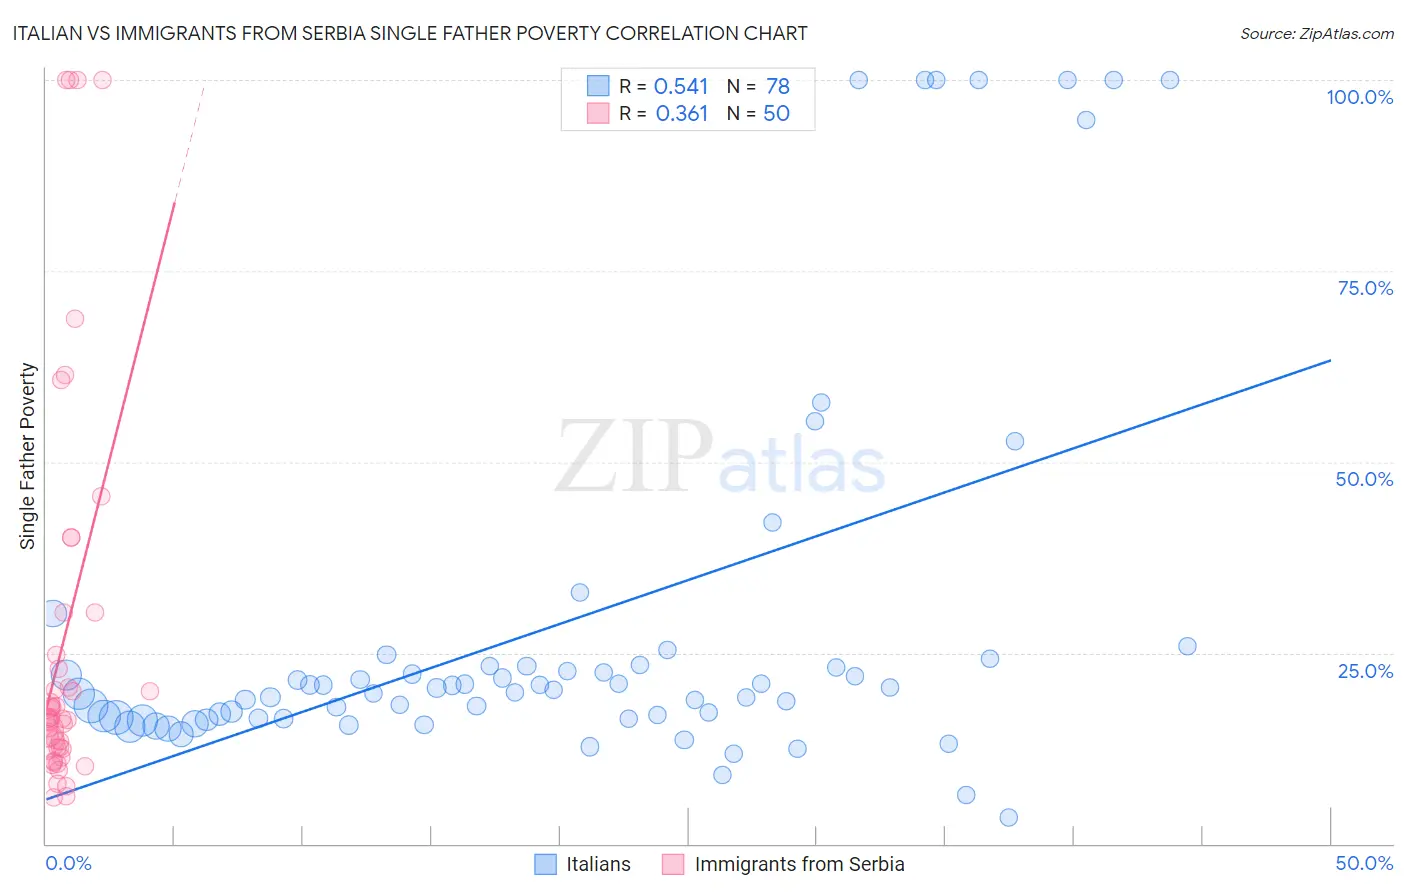
Italian vs Immigrants from Serbia Single Father Poverty Correlation Chart
The statistical analysis conducted on geographies consisting of 411,059,801 people shows a substantial positive correlation between the proportion of Italians and poverty level among single fathers in the United States with a correlation coefficient (R) of 0.541 and weighted average of 17.5%. Similarly, the statistical analysis conducted on geographies consisting of 114,512,326 people shows a mild positive correlation between the proportion of Immigrants from Serbia and poverty level among single fathers in the United States with a correlation coefficient (R) of 0.361 and weighted average of 15.5%, a difference of 12.9%.
Single Father Poverty Correlation Summary
| Measurement | Italian | Immigrants from Serbia |
| Minimum | 3.4% | 6.1% |
| Maximum | 100.0% | 100.0% |
| Range | 96.6% | 93.9% |
| Mean | 28.7% | 26.6% |
| Median | 20.3% | 16.4% |
| Interquartile 25% (IQ1) | 16.4% | 12.5% |
| Interquartile 75% (IQ3) | 23.3% | 24.8% |
| Interquartile Range (IQR) | 6.9% | 12.2% |
| Standard Deviation (Sample) | 25.6% | 25.8% |
| Standard Deviation (Population) | 25.4% | 25.6% |
Similar Demographics by Single Father Poverty
Demographics Similar to Italians by Single Father Poverty
In terms of single father poverty, the demographic groups most similar to Italians are Barbadian (17.5%, a difference of 0.28%), French American Indian (17.4%, a difference of 0.63%), Macedonian (17.7%, a difference of 0.66%), British West Indian (17.7%, a difference of 0.72%), and Indonesian (17.4%, a difference of 0.77%).
| Demographics | Rating | Rank | Single Father Poverty |
| Jamaicans | 0.3 /100 | #266 | Tragic 17.3% |
| Haitians | 0.3 /100 | #267 | Tragic 17.3% |
| Immigrants | Caribbean | 0.3 /100 | #268 | Tragic 17.4% |
| Slavs | 0.3 /100 | #269 | Tragic 17.4% |
| Indonesians | 0.2 /100 | #270 | Tragic 17.4% |
| French American Indians | 0.2 /100 | #271 | Tragic 17.4% |
| Barbadians | 0.1 /100 | #272 | Tragic 17.5% |
| Italians | 0.1 /100 | #273 | Tragic 17.5% |
| Macedonians | 0.1 /100 | #274 | Tragic 17.7% |
| British West Indians | 0.0 /100 | #275 | Tragic 17.7% |
| German Russians | 0.0 /100 | #276 | Tragic 17.7% |
| Lebanese | 0.0 /100 | #277 | Tragic 17.7% |
| Germans | 0.0 /100 | #278 | Tragic 17.7% |
| Iroquois | 0.0 /100 | #279 | Tragic 17.7% |
| Scottish | 0.0 /100 | #280 | Tragic 17.7% |
Demographics Similar to Immigrants from Serbia by Single Father Poverty
In terms of single father poverty, the demographic groups most similar to Immigrants from Serbia are Basque (15.5%, a difference of 0.040%), Immigrants from Romania (15.5%, a difference of 0.11%), Immigrants from Uruguay (15.6%, a difference of 0.17%), Mexican American Indian (15.5%, a difference of 0.21%), and Immigrants from Kazakhstan (15.6%, a difference of 0.23%).
| Demographics | Rating | Rank | Single Father Poverty |
| Immigrants | Oceania | 99.1 /100 | #85 | Exceptional 15.4% |
| Immigrants | Russia | 99.0 /100 | #86 | Exceptional 15.5% |
| Brazilians | 99.0 /100 | #87 | Exceptional 15.5% |
| Burmese | 99.0 /100 | #88 | Exceptional 15.5% |
| Immigrants | Korea | 99.0 /100 | #89 | Exceptional 15.5% |
| Mexican American Indians | 98.7 /100 | #90 | Exceptional 15.5% |
| Immigrants | Romania | 98.6 /100 | #91 | Exceptional 15.5% |
| Immigrants | Serbia | 98.5 /100 | #92 | Exceptional 15.5% |
| Basques | 98.4 /100 | #93 | Exceptional 15.5% |
| Immigrants | Uruguay | 98.2 /100 | #94 | Exceptional 15.6% |
| Immigrants | Kazakhstan | 98.2 /100 | #95 | Exceptional 15.6% |
| Immigrants | Belgium | 98.1 /100 | #96 | Exceptional 15.6% |
| Yaqui | 98.1 /100 | #97 | Exceptional 15.6% |
| Zimbabweans | 98.1 /100 | #98 | Exceptional 15.6% |
| Immigrants | Middle Africa | 97.4 /100 | #99 | Exceptional 15.6% |