Black/African American vs Immigrants from Hungary Single Father Poverty
COMPARE
Black/African American
Immigrants from Hungary
Single Father Poverty
Single Father Poverty Comparison
Blacks/African Americans
Immigrants from Hungary
20.4%
SINGLE FATHER POVERTY
0.0/ 100
METRIC RATING
325th/ 347
METRIC RANK
16.1%
SINGLE FATHER POVERTY
78.3/ 100
METRIC RATING
146th/ 347
METRIC RANK
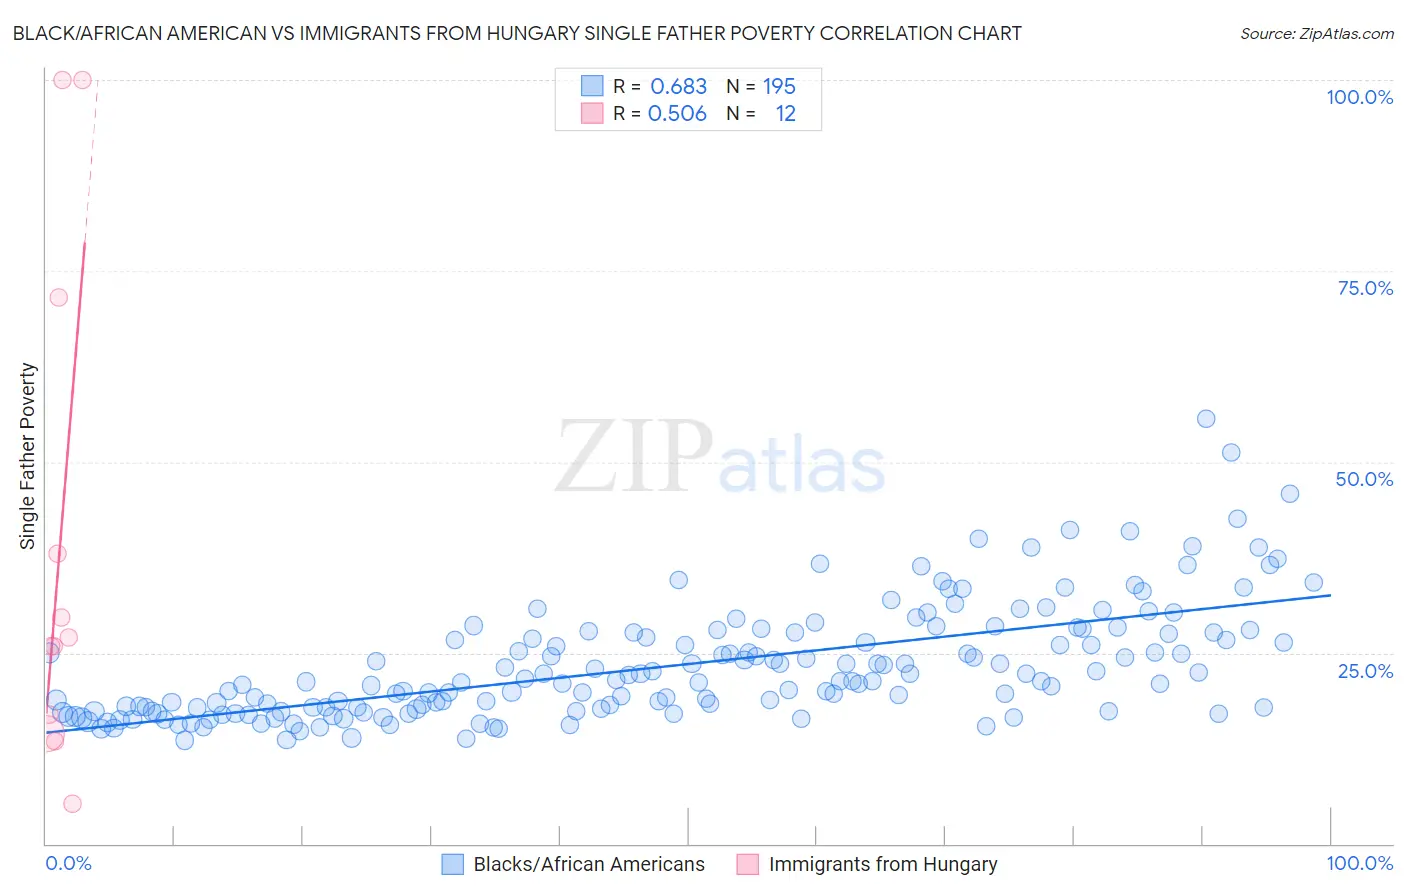
Black/African American vs Immigrants from Hungary Single Father Poverty Correlation Chart
The statistical analysis conducted on geographies consisting of 410,273,271 people shows a significant positive correlation between the proportion of Blacks/African Americans and poverty level among single fathers in the United States with a correlation coefficient (R) of 0.683 and weighted average of 20.4%. Similarly, the statistical analysis conducted on geographies consisting of 163,698,265 people shows a substantial positive correlation between the proportion of Immigrants from Hungary and poverty level among single fathers in the United States with a correlation coefficient (R) of 0.506 and weighted average of 16.1%, a difference of 26.9%.
Single Father Poverty Correlation Summary
| Measurement | Black/African American | Immigrants from Hungary |
| Minimum | 13.5% | 5.2% |
| Maximum | 55.6% | 100.0% |
| Range | 42.1% | 94.8% |
| Mean | 23.3% | 39.0% |
| Median | 21.3% | 26.4% |
| Interquartile 25% (IQ1) | 17.6% | 15.7% |
| Interquartile 75% (IQ3) | 27.7% | 54.8% |
| Interquartile Range (IQR) | 10.1% | 39.1% |
| Standard Deviation (Sample) | 7.4% | 33.0% |
| Standard Deviation (Population) | 7.4% | 31.6% |
Similar Demographics by Single Father Poverty
Demographics Similar to Blacks/African Americans by Single Father Poverty
In terms of single father poverty, the demographic groups most similar to Blacks/African Americans are Immigrants from Yemen (20.6%, a difference of 1.0%), American (20.1%, a difference of 1.6%), Choctaw (20.7%, a difference of 1.7%), Pennsylvania German (20.0%, a difference of 1.8%), and Creek (19.8%, a difference of 2.7%).
| Demographics | Rating | Rank | Single Father Poverty |
| Dutch West Indians | 0.0 /100 | #318 | Tragic 19.2% |
| Slovaks | 0.0 /100 | #319 | Tragic 19.3% |
| Inupiat | 0.0 /100 | #320 | Tragic 19.5% |
| Cherokee | 0.0 /100 | #321 | Tragic 19.6% |
| Creek | 0.0 /100 | #322 | Tragic 19.8% |
| Pennsylvania Germans | 0.0 /100 | #323 | Tragic 20.0% |
| Americans | 0.0 /100 | #324 | Tragic 20.1% |
| Blacks/African Americans | 0.0 /100 | #325 | Tragic 20.4% |
| Immigrants | Yemen | 0.0 /100 | #326 | Tragic 20.6% |
| Choctaw | 0.0 /100 | #327 | Tragic 20.7% |
| Pueblo | 0.0 /100 | #328 | Tragic 21.1% |
| Colville | 0.0 /100 | #329 | Tragic 21.4% |
| Paiute | 0.0 /100 | #330 | Tragic 21.6% |
| Central American Indians | 0.0 /100 | #331 | Tragic 21.7% |
| Tohono O'odham | 0.0 /100 | #332 | Tragic 22.0% |
Demographics Similar to Immigrants from Hungary by Single Father Poverty
In terms of single father poverty, the demographic groups most similar to Immigrants from Hungary are Colombian (16.1%, a difference of 0.080%), Nigerian (16.1%, a difference of 0.10%), Immigrants from Western Asia (16.0%, a difference of 0.16%), South African (16.1%, a difference of 0.20%), and Immigrants from Kuwait (16.0%, a difference of 0.22%).
| Demographics | Rating | Rank | Single Father Poverty |
| South Americans | 85.9 /100 | #139 | Excellent 16.0% |
| Immigrants | Netherlands | 85.3 /100 | #140 | Excellent 16.0% |
| Liberians | 83.3 /100 | #141 | Excellent 16.0% |
| Immigrants | Mexico | 83.3 /100 | #142 | Excellent 16.0% |
| Immigrants | Central America | 83.1 /100 | #143 | Excellent 16.0% |
| Immigrants | Kuwait | 81.4 /100 | #144 | Excellent 16.0% |
| Immigrants | Western Asia | 80.7 /100 | #145 | Excellent 16.0% |
| Immigrants | Hungary | 78.3 /100 | #146 | Good 16.1% |
| Colombians | 77.1 /100 | #147 | Good 16.1% |
| Nigerians | 76.8 /100 | #148 | Good 16.1% |
| South Africans | 75.1 /100 | #149 | Good 16.1% |
| Jordanians | 74.2 /100 | #150 | Good 16.1% |
| Immigrants | France | 73.1 /100 | #151 | Good 16.1% |
| Immigrants | Zimbabwe | 72.1 /100 | #152 | Good 16.1% |
| Immigrants | Israel | 72.0 /100 | #153 | Good 16.1% |