Italian vs Immigrants from Liberia Single Father Poverty
COMPARE
Italian
Immigrants from Liberia
Single Father Poverty
Single Father Poverty Comparison
Italians
Immigrants from Liberia
17.5%
SINGLE FATHER POVERTY
0.1/ 100
METRIC RATING
273rd/ 347
METRIC RANK
15.9%
SINGLE FATHER POVERTY
91.1/ 100
METRIC RATING
127th/ 347
METRIC RANK
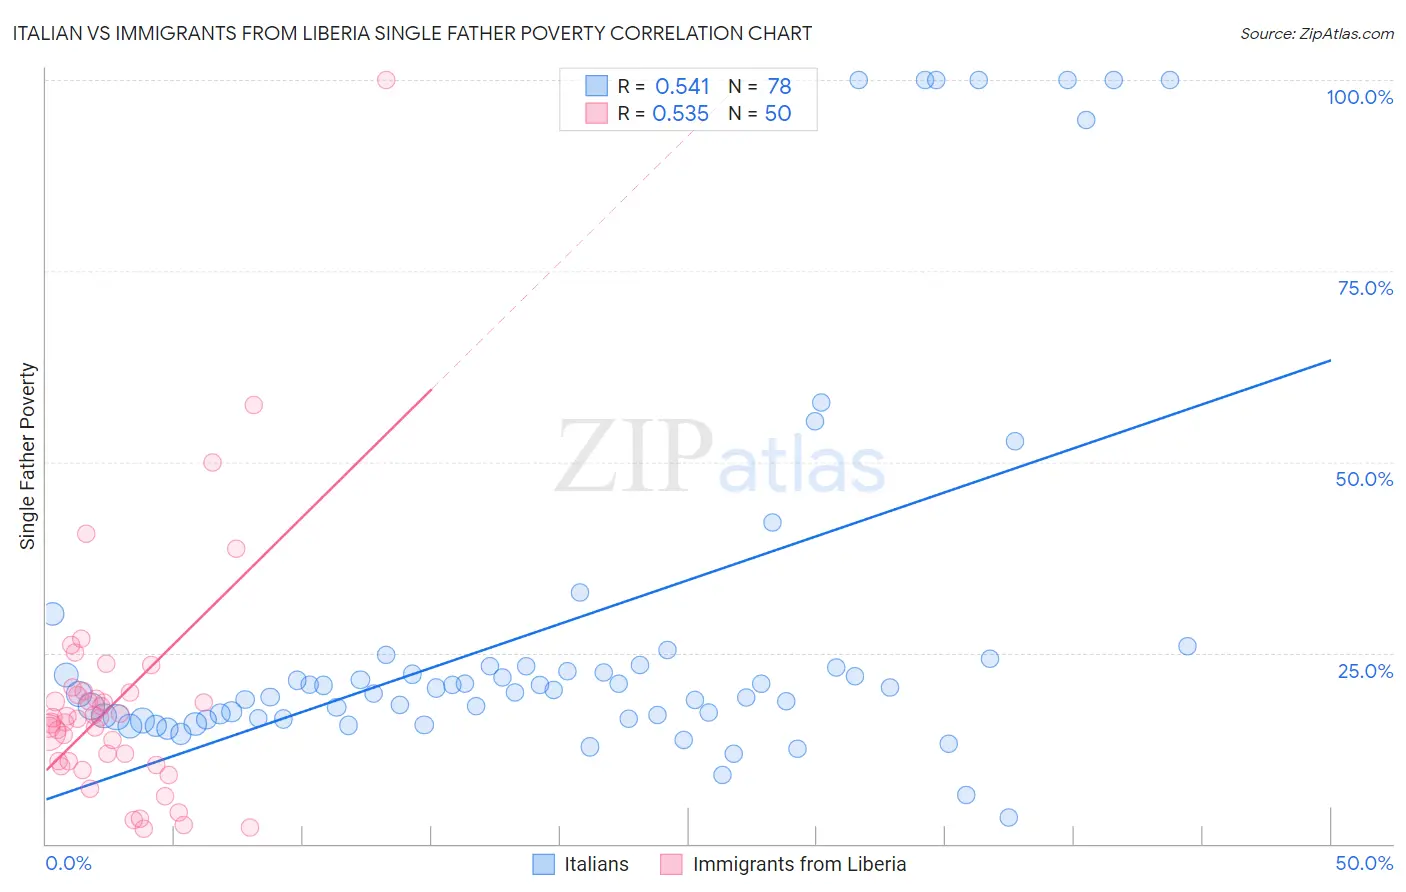
Italian vs Immigrants from Liberia Single Father Poverty Correlation Chart
The statistical analysis conducted on geographies consisting of 411,059,801 people shows a substantial positive correlation between the proportion of Italians and poverty level among single fathers in the United States with a correlation coefficient (R) of 0.541 and weighted average of 17.5%. Similarly, the statistical analysis conducted on geographies consisting of 122,784,105 people shows a substantial positive correlation between the proportion of Immigrants from Liberia and poverty level among single fathers in the United States with a correlation coefficient (R) of 0.535 and weighted average of 15.9%, a difference of 10.5%.
Single Father Poverty Correlation Summary
| Measurement | Italian | Immigrants from Liberia |
| Minimum | 3.4% | 2.0% |
| Maximum | 100.0% | 100.0% |
| Range | 96.6% | 98.0% |
| Mean | 28.7% | 18.7% |
| Median | 20.3% | 16.5% |
| Interquartile 25% (IQ1) | 16.4% | 10.8% |
| Interquartile 75% (IQ3) | 23.3% | 19.8% |
| Interquartile Range (IQR) | 6.9% | 9.0% |
| Standard Deviation (Sample) | 25.6% | 16.1% |
| Standard Deviation (Population) | 25.4% | 15.9% |
Similar Demographics by Single Father Poverty
Demographics Similar to Italians by Single Father Poverty
In terms of single father poverty, the demographic groups most similar to Italians are Barbadian (17.5%, a difference of 0.28%), French American Indian (17.4%, a difference of 0.63%), Macedonian (17.7%, a difference of 0.66%), British West Indian (17.7%, a difference of 0.72%), and Indonesian (17.4%, a difference of 0.77%).
| Demographics | Rating | Rank | Single Father Poverty |
| Jamaicans | 0.3 /100 | #266 | Tragic 17.3% |
| Haitians | 0.3 /100 | #267 | Tragic 17.3% |
| Immigrants | Caribbean | 0.3 /100 | #268 | Tragic 17.4% |
| Slavs | 0.3 /100 | #269 | Tragic 17.4% |
| Indonesians | 0.2 /100 | #270 | Tragic 17.4% |
| French American Indians | 0.2 /100 | #271 | Tragic 17.4% |
| Barbadians | 0.1 /100 | #272 | Tragic 17.5% |
| Italians | 0.1 /100 | #273 | Tragic 17.5% |
| Macedonians | 0.1 /100 | #274 | Tragic 17.7% |
| British West Indians | 0.0 /100 | #275 | Tragic 17.7% |
| German Russians | 0.0 /100 | #276 | Tragic 17.7% |
| Lebanese | 0.0 /100 | #277 | Tragic 17.7% |
| Germans | 0.0 /100 | #278 | Tragic 17.7% |
| Iroquois | 0.0 /100 | #279 | Tragic 17.7% |
| Scottish | 0.0 /100 | #280 | Tragic 17.7% |
Demographics Similar to Immigrants from Liberia by Single Father Poverty
In terms of single father poverty, the demographic groups most similar to Immigrants from Liberia are Hmong (15.9%, a difference of 0.010%), Iraqi (15.9%, a difference of 0.020%), Immigrants from Panama (15.9%, a difference of 0.030%), Immigrants from Nigeria (15.9%, a difference of 0.030%), and Palestinian (15.9%, a difference of 0.040%).
| Demographics | Rating | Rank | Single Father Poverty |
| Uruguayans | 92.1 /100 | #120 | Exceptional 15.9% |
| Immigrants | Immigrants | 91.9 /100 | #121 | Exceptional 15.9% |
| Sudanese | 91.6 /100 | #122 | Exceptional 15.9% |
| Palestinians | 91.3 /100 | #123 | Exceptional 15.9% |
| Immigrants | Panama | 91.3 /100 | #124 | Exceptional 15.9% |
| Iraqis | 91.2 /100 | #125 | Exceptional 15.9% |
| Hmong | 91.1 /100 | #126 | Exceptional 15.9% |
| Immigrants | Liberia | 91.1 /100 | #127 | Exceptional 15.9% |
| Immigrants | Nigeria | 90.8 /100 | #128 | Exceptional 15.9% |
| Immigrants | West Indies | 90.8 /100 | #129 | Exceptional 15.9% |
| Norwegians | 90.2 /100 | #130 | Exceptional 15.9% |
| Nicaraguans | 90.1 /100 | #131 | Exceptional 15.9% |
| Immigrants | Portugal | 89.7 /100 | #132 | Excellent 15.9% |
| Immigrants | Syria | 89.5 /100 | #133 | Excellent 15.9% |
| Immigrants | South America | 88.5 /100 | #134 | Excellent 15.9% |