Central American Indian vs Immigrants from Hungary Single Father Poverty
COMPARE
Central American Indian
Immigrants from Hungary
Single Father Poverty
Single Father Poverty Comparison
Central American Indians
Immigrants from Hungary
21.7%
SINGLE FATHER POVERTY
0.0/ 100
METRIC RATING
331st/ 347
METRIC RANK
16.1%
SINGLE FATHER POVERTY
78.3/ 100
METRIC RATING
146th/ 347
METRIC RANK
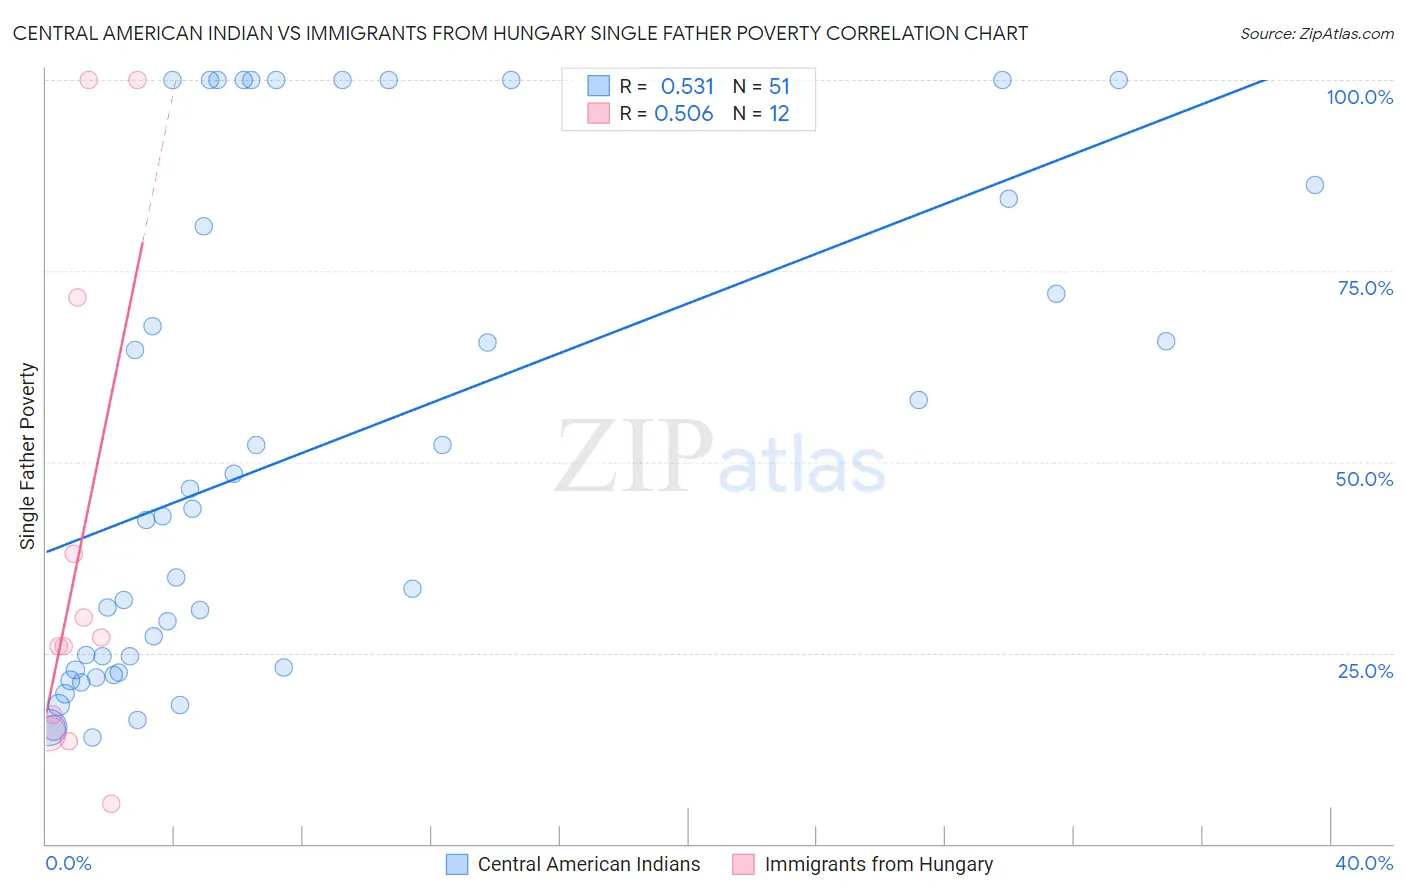
Central American Indian vs Immigrants from Hungary Single Father Poverty Correlation Chart
The statistical analysis conducted on geographies consisting of 271,383,000 people shows a substantial positive correlation between the proportion of Central American Indians and poverty level among single fathers in the United States with a correlation coefficient (R) of 0.531 and weighted average of 21.7%. Similarly, the statistical analysis conducted on geographies consisting of 163,698,265 people shows a substantial positive correlation between the proportion of Immigrants from Hungary and poverty level among single fathers in the United States with a correlation coefficient (R) of 0.506 and weighted average of 16.1%, a difference of 35.0%.
Single Father Poverty Correlation Summary
| Measurement | Central American Indian | Immigrants from Hungary |
| Minimum | 13.9% | 5.2% |
| Maximum | 100.0% | 100.0% |
| Range | 86.1% | 94.8% |
| Mean | 51.7% | 39.0% |
| Median | 42.9% | 26.4% |
| Interquartile 25% (IQ1) | 22.7% | 15.7% |
| Interquartile 75% (IQ3) | 84.4% | 54.8% |
| Interquartile Range (IQR) | 61.6% | 39.1% |
| Standard Deviation (Sample) | 31.7% | 33.0% |
| Standard Deviation (Population) | 31.4% | 31.6% |
Similar Demographics by Single Father Poverty
Demographics Similar to Central American Indians by Single Father Poverty
In terms of single father poverty, the demographic groups most similar to Central American Indians are Paiute (21.6%, a difference of 0.27%), Tohono O'odham (22.0%, a difference of 1.5%), Colville (21.4%, a difference of 1.5%), Pueblo (21.1%, a difference of 2.6%), and Native/Alaskan (22.4%, a difference of 3.3%).
| Demographics | Rating | Rank | Single Father Poverty |
| Americans | 0.0 /100 | #324 | Tragic 20.1% |
| Blacks/African Americans | 0.0 /100 | #325 | Tragic 20.4% |
| Immigrants | Yemen | 0.0 /100 | #326 | Tragic 20.6% |
| Choctaw | 0.0 /100 | #327 | Tragic 20.7% |
| Pueblo | 0.0 /100 | #328 | Tragic 21.1% |
| Colville | 0.0 /100 | #329 | Tragic 21.4% |
| Paiute | 0.0 /100 | #330 | Tragic 21.6% |
| Central American Indians | 0.0 /100 | #331 | Tragic 21.7% |
| Tohono O'odham | 0.0 /100 | #332 | Tragic 22.0% |
| Natives/Alaskans | 0.0 /100 | #333 | Tragic 22.4% |
| Kiowa | 0.0 /100 | #334 | Tragic 22.5% |
| Shoshone | 0.0 /100 | #335 | Tragic 22.9% |
| Cajuns | 0.0 /100 | #336 | Tragic 23.1% |
| Sioux | 0.0 /100 | #337 | Tragic 23.9% |
| Arapaho | 0.0 /100 | #338 | Tragic 24.0% |
Demographics Similar to Immigrants from Hungary by Single Father Poverty
In terms of single father poverty, the demographic groups most similar to Immigrants from Hungary are Colombian (16.1%, a difference of 0.080%), Nigerian (16.1%, a difference of 0.10%), Immigrants from Western Asia (16.0%, a difference of 0.16%), South African (16.1%, a difference of 0.20%), and Immigrants from Kuwait (16.0%, a difference of 0.22%).
| Demographics | Rating | Rank | Single Father Poverty |
| South Americans | 85.9 /100 | #139 | Excellent 16.0% |
| Immigrants | Netherlands | 85.3 /100 | #140 | Excellent 16.0% |
| Liberians | 83.3 /100 | #141 | Excellent 16.0% |
| Immigrants | Mexico | 83.3 /100 | #142 | Excellent 16.0% |
| Immigrants | Central America | 83.1 /100 | #143 | Excellent 16.0% |
| Immigrants | Kuwait | 81.4 /100 | #144 | Excellent 16.0% |
| Immigrants | Western Asia | 80.7 /100 | #145 | Excellent 16.0% |
| Immigrants | Hungary | 78.3 /100 | #146 | Good 16.1% |
| Colombians | 77.1 /100 | #147 | Good 16.1% |
| Nigerians | 76.8 /100 | #148 | Good 16.1% |
| South Africans | 75.1 /100 | #149 | Good 16.1% |
| Jordanians | 74.2 /100 | #150 | Good 16.1% |
| Immigrants | France | 73.1 /100 | #151 | Good 16.1% |
| Immigrants | Zimbabwe | 72.1 /100 | #152 | Good 16.1% |
| Immigrants | Israel | 72.0 /100 | #153 | Good 16.1% |