Inupiat vs Puget Sound Salish Female Poverty
COMPARE
Inupiat
Puget Sound Salish
Female Poverty
Female Poverty Comparison
Inupiat
Puget Sound Salish
16.2%
FEMALE POVERTY
0.0/ 100
METRIC RATING
286th/ 347
METRIC RANK
12.7%
FEMALE POVERTY
91.5/ 100
METRIC RATING
115th/ 347
METRIC RANK
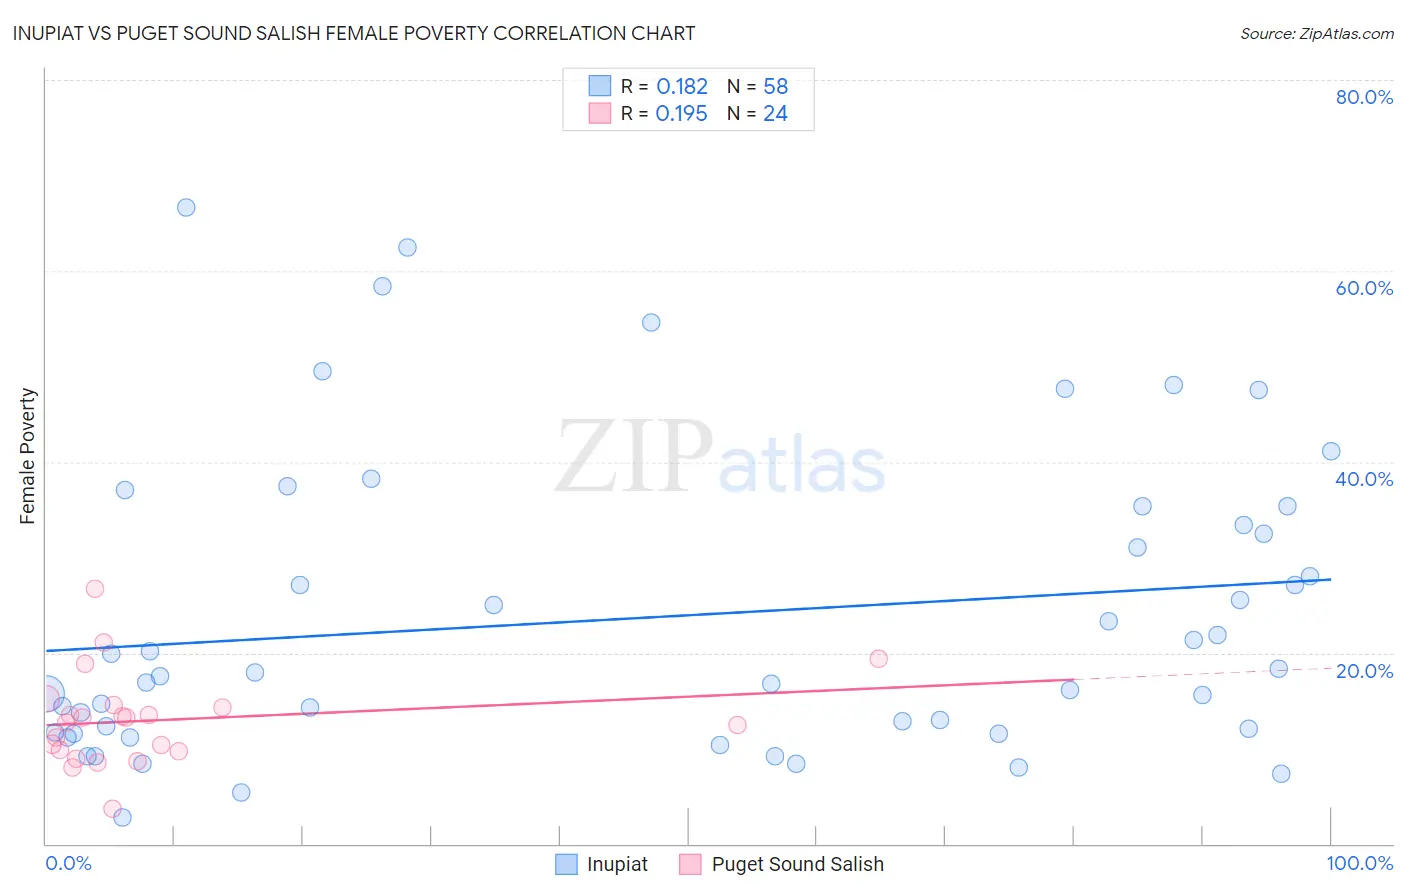
Inupiat vs Puget Sound Salish Female Poverty Correlation Chart
The statistical analysis conducted on geographies consisting of 96,314,579 people shows a poor positive correlation between the proportion of Inupiat and poverty level among females in the United States with a correlation coefficient (R) of 0.182 and weighted average of 16.2%. Similarly, the statistical analysis conducted on geographies consisting of 46,146,424 people shows a poor positive correlation between the proportion of Puget Sound Salish and poverty level among females in the United States with a correlation coefficient (R) of 0.195 and weighted average of 12.7%, a difference of 28.2%.
Female Poverty Correlation Summary
| Measurement | Inupiat | Puget Sound Salish |
| Minimum | 2.8% | 3.6% |
| Maximum | 66.7% | 26.7% |
| Range | 63.9% | 23.1% |
| Mean | 23.7% | 13.0% |
| Median | 17.7% | 13.0% |
| Interquartile 25% (IQ1) | 11.6% | 9.8% |
| Interquartile 75% (IQ3) | 33.3% | 14.4% |
| Interquartile Range (IQR) | 21.7% | 4.7% |
| Standard Deviation (Sample) | 15.6% | 4.9% |
| Standard Deviation (Population) | 15.5% | 4.8% |
Similar Demographics by Female Poverty
Demographics Similar to Inupiat by Female Poverty
In terms of female poverty, the demographic groups most similar to Inupiat are Immigrants from Belize (16.3%, a difference of 0.19%), Comanche (16.2%, a difference of 0.44%), Spanish American (16.2%, a difference of 0.52%), Immigrants from Cuba (16.1%, a difference of 0.57%), and Immigrants from Haiti (16.1%, a difference of 0.65%).
| Demographics | Rating | Rank | Female Poverty |
| Immigrants | Bahamas | 0.0 /100 | #279 | Tragic 16.1% |
| Vietnamese | 0.0 /100 | #280 | Tragic 16.1% |
| West Indians | 0.0 /100 | #281 | Tragic 16.1% |
| Immigrants | Haiti | 0.0 /100 | #282 | Tragic 16.1% |
| Immigrants | Cuba | 0.0 /100 | #283 | Tragic 16.1% |
| Spanish Americans | 0.0 /100 | #284 | Tragic 16.2% |
| Comanche | 0.0 /100 | #285 | Tragic 16.2% |
| Inupiat | 0.0 /100 | #286 | Tragic 16.2% |
| Immigrants | Belize | 0.0 /100 | #287 | Tragic 16.3% |
| Indonesians | 0.0 /100 | #288 | Tragic 16.4% |
| Blackfeet | 0.0 /100 | #289 | Tragic 16.4% |
| Immigrants | Bangladesh | 0.0 /100 | #290 | Tragic 16.4% |
| Yaqui | 0.0 /100 | #291 | Tragic 16.4% |
| Immigrants | Zaire | 0.0 /100 | #292 | Tragic 16.4% |
| Immigrants | Latin America | 0.0 /100 | #293 | Tragic 16.4% |
Demographics Similar to Puget Sound Salish by Female Poverty
In terms of female poverty, the demographic groups most similar to Puget Sound Salish are Welsh (12.7%, a difference of 0.020%), Immigrants from Russia (12.7%, a difference of 0.12%), Canadian (12.7%, a difference of 0.14%), Immigrants from Israel (12.6%, a difference of 0.17%), and Immigrants from Southern Europe (12.7%, a difference of 0.20%).
| Demographics | Rating | Rank | Female Poverty |
| Portuguese | 93.1 /100 | #108 | Exceptional 12.6% |
| Immigrants | Zimbabwe | 93.1 /100 | #109 | Exceptional 12.6% |
| Paraguayans | 93.0 /100 | #110 | Exceptional 12.6% |
| Soviet Union | 92.4 /100 | #111 | Exceptional 12.6% |
| Immigrants | Israel | 92.0 /100 | #112 | Exceptional 12.6% |
| Canadians | 92.0 /100 | #113 | Exceptional 12.7% |
| Welsh | 91.6 /100 | #114 | Exceptional 12.7% |
| Puget Sound Salish | 91.5 /100 | #115 | Exceptional 12.7% |
| Immigrants | Russia | 91.2 /100 | #116 | Exceptional 12.7% |
| Immigrants | Southern Europe | 90.9 /100 | #117 | Exceptional 12.7% |
| Sri Lankans | 90.9 /100 | #118 | Exceptional 12.7% |
| Albanians | 90.8 /100 | #119 | Exceptional 12.7% |
| New Zealanders | 90.6 /100 | #120 | Exceptional 12.7% |
| Immigrants | Hungary | 90.3 /100 | #121 | Exceptional 12.7% |
| French Canadians | 90.2 /100 | #122 | Exceptional 12.7% |