Indonesian vs Chickasaw Poverty
COMPARE
Indonesian
Chickasaw
Poverty
Poverty Comparison
Indonesians
Chickasaw
15.1%
POVERTY
0.0/ 100
METRIC RATING
292nd/ 347
METRIC RANK
14.7%
POVERTY
0.0/ 100
METRIC RATING
272nd/ 347
METRIC RANK
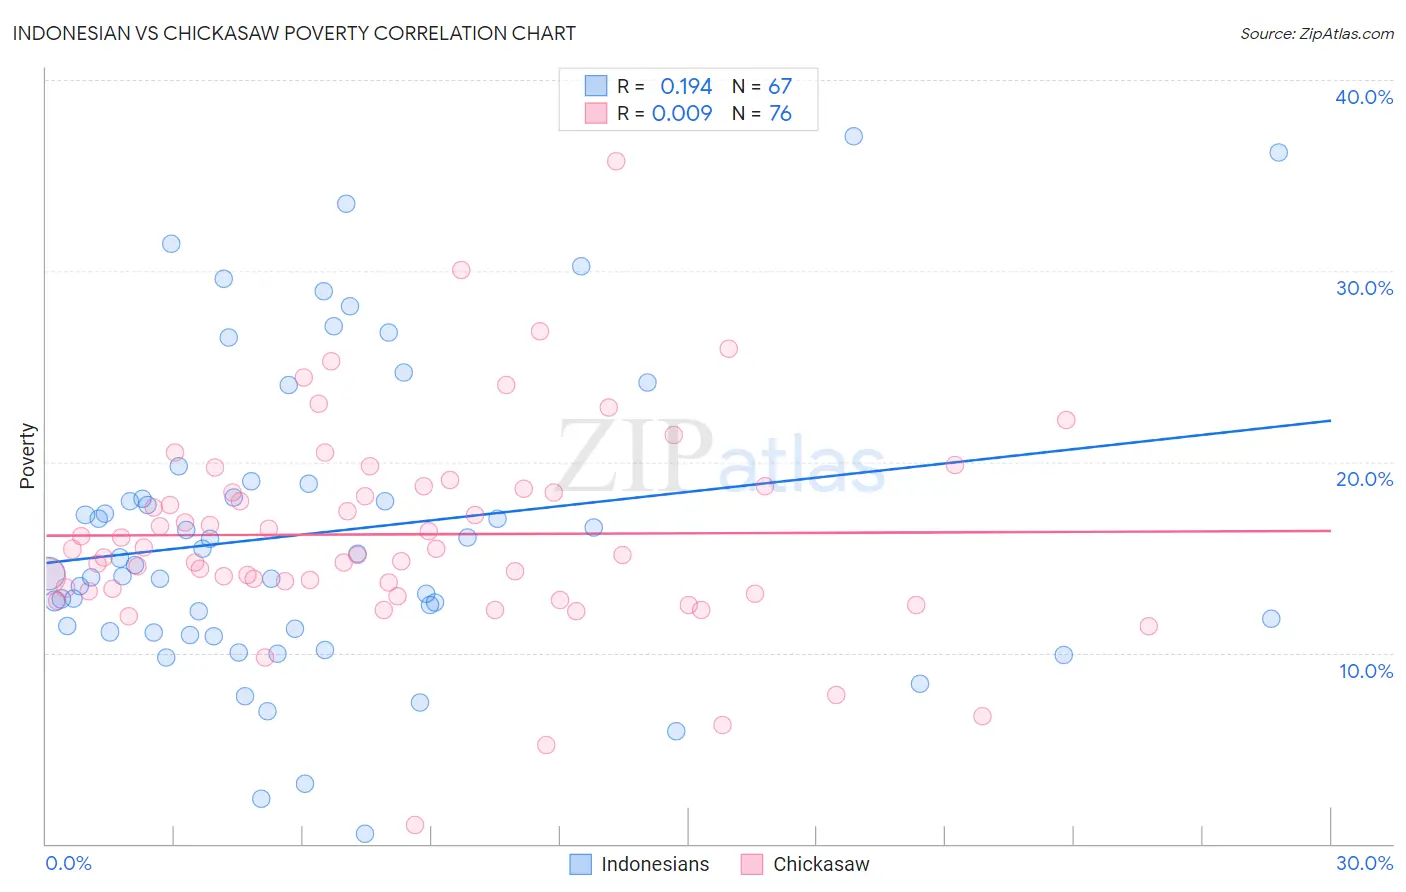
Indonesian vs Chickasaw Poverty Correlation Chart
The statistical analysis conducted on geographies consisting of 162,655,405 people shows a poor positive correlation between the proportion of Indonesians and poverty level in the United States with a correlation coefficient (R) of 0.194 and weighted average of 15.1%. Similarly, the statistical analysis conducted on geographies consisting of 147,672,043 people shows no correlation between the proportion of Chickasaw and poverty level in the United States with a correlation coefficient (R) of 0.009 and weighted average of 14.7%, a difference of 3.1%.
Poverty Correlation Summary
| Measurement | Indonesian | Chickasaw |
| Minimum | 0.56% | 0.99% |
| Maximum | 37.0% | 35.7% |
| Range | 36.5% | 34.7% |
| Mean | 16.3% | 16.2% |
| Median | 14.6% | 15.3% |
| Interquartile 25% (IQ1) | 11.1% | 13.3% |
| Interquartile 75% (IQ3) | 18.9% | 18.7% |
| Interquartile Range (IQR) | 7.8% | 5.4% |
| Standard Deviation (Sample) | 7.9% | 5.4% |
| Standard Deviation (Population) | 7.9% | 5.4% |
Demographics Similar to Indonesians and Chickasaw by Poverty
In terms of poverty, the demographic groups most similar to Indonesians are Immigrants from Cabo Verde (15.1%, a difference of 0.050%), Mexican (15.1%, a difference of 0.18%), Immigrants from Belize (15.1%, a difference of 0.28%), Yaqui (15.1%, a difference of 0.40%), and Inupiat (15.1%, a difference of 0.41%). Similarly, the demographic groups most similar to Chickasaw are Spanish American (14.7%, a difference of 0.53%), Barbadian (14.8%, a difference of 0.93%), Immigrants from West Indies (14.8%, a difference of 0.96%), Immigrants from Bahamas (14.8%, a difference of 0.97%), and Bangladeshi (14.8%, a difference of 1.0%).
| Demographics | Rating | Rank | Poverty |
| Chickasaw | 0.0 /100 | #272 | Tragic 14.7% |
| Spanish Americans | 0.0 /100 | #273 | Tragic 14.7% |
| Barbadians | 0.0 /100 | #274 | Tragic 14.8% |
| Immigrants | West Indies | 0.0 /100 | #275 | Tragic 14.8% |
| Immigrants | Bahamas | 0.0 /100 | #276 | Tragic 14.8% |
| Bangladeshis | 0.0 /100 | #277 | Tragic 14.8% |
| Belizeans | 0.0 /100 | #278 | Tragic 14.8% |
| Immigrants | St. Vincent and the Grenadines | 0.0 /100 | #279 | Tragic 14.9% |
| Haitians | 0.0 /100 | #280 | Tragic 14.9% |
| Immigrants | Barbados | 0.0 /100 | #281 | Tragic 14.9% |
| Comanche | 0.0 /100 | #282 | Tragic 15.0% |
| Immigrants | Haiti | 0.0 /100 | #283 | Tragic 15.0% |
| West Indians | 0.0 /100 | #284 | Tragic 15.0% |
| Vietnamese | 0.0 /100 | #285 | Tragic 15.0% |
| Immigrants | Latin America | 0.0 /100 | #286 | Tragic 15.0% |
| Inupiat | 0.0 /100 | #287 | Tragic 15.1% |
| Yaqui | 0.0 /100 | #288 | Tragic 15.1% |
| Immigrants | Belize | 0.0 /100 | #289 | Tragic 15.1% |
| Mexicans | 0.0 /100 | #290 | Tragic 15.1% |
| Immigrants | Cabo Verde | 0.0 /100 | #291 | Tragic 15.1% |
| Indonesians | 0.0 /100 | #292 | Tragic 15.1% |