Indonesian vs Subsaharan African Poverty
COMPARE
Indonesian
Subsaharan African
Poverty
Poverty Comparison
Indonesians
Sub-Saharan Africans
15.1%
POVERTY
0.0/ 100
METRIC RATING
292nd/ 347
METRIC RANK
14.5%
POVERTY
0.1/ 100
METRIC RATING
268th/ 347
METRIC RANK
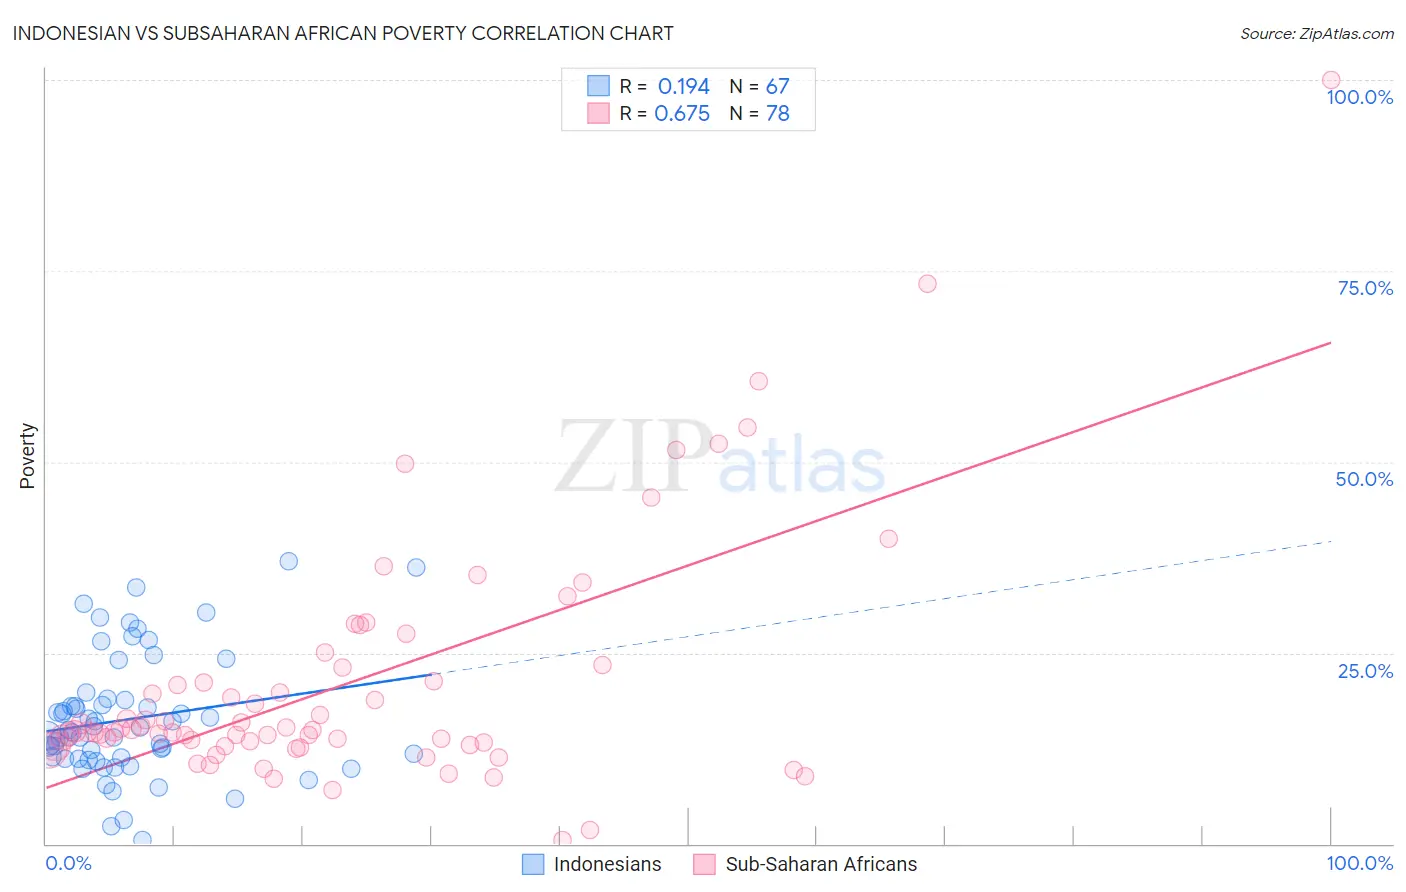
Indonesian vs Subsaharan African Poverty Correlation Chart
The statistical analysis conducted on geographies consisting of 162,655,405 people shows a poor positive correlation between the proportion of Indonesians and poverty level in the United States with a correlation coefficient (R) of 0.194 and weighted average of 15.1%. Similarly, the statistical analysis conducted on geographies consisting of 507,618,351 people shows a significant positive correlation between the proportion of Sub-Saharan Africans and poverty level in the United States with a correlation coefficient (R) of 0.675 and weighted average of 14.5%, a difference of 4.1%.
Poverty Correlation Summary
| Measurement | Indonesian | Subsaharan African |
| Minimum | 0.56% | 0.57% |
| Maximum | 37.0% | 100.0% |
| Range | 36.5% | 99.4% |
| Mean | 16.3% | 21.1% |
| Median | 14.6% | 14.9% |
| Interquartile 25% (IQ1) | 11.1% | 12.9% |
| Interquartile 75% (IQ3) | 18.9% | 23.1% |
| Interquartile Range (IQR) | 7.8% | 10.2% |
| Standard Deviation (Sample) | 7.9% | 16.2% |
| Standard Deviation (Population) | 7.9% | 16.1% |
Similar Demographics by Poverty
Demographics Similar to Indonesians by Poverty
In terms of poverty, the demographic groups most similar to Indonesians are Immigrants from Zaire (15.1%, a difference of 0.010%), Immigrants from Cabo Verde (15.1%, a difference of 0.050%), Mexican (15.1%, a difference of 0.18%), Immigrants from Belize (15.1%, a difference of 0.28%), and Yaqui (15.1%, a difference of 0.40%).
| Demographics | Rating | Rank | Poverty |
| Vietnamese | 0.0 /100 | #285 | Tragic 15.0% |
| Immigrants | Latin America | 0.0 /100 | #286 | Tragic 15.0% |
| Inupiat | 0.0 /100 | #287 | Tragic 15.1% |
| Yaqui | 0.0 /100 | #288 | Tragic 15.1% |
| Immigrants | Belize | 0.0 /100 | #289 | Tragic 15.1% |
| Mexicans | 0.0 /100 | #290 | Tragic 15.1% |
| Immigrants | Cabo Verde | 0.0 /100 | #291 | Tragic 15.1% |
| Indonesians | 0.0 /100 | #292 | Tragic 15.1% |
| Immigrants | Zaire | 0.0 /100 | #293 | Tragic 15.1% |
| Blackfeet | 0.0 /100 | #294 | Tragic 15.2% |
| Guatemalans | 0.0 /100 | #295 | Tragic 15.3% |
| Hispanics or Latinos | 0.0 /100 | #296 | Tragic 15.3% |
| Immigrants | Bangladesh | 0.0 /100 | #297 | Tragic 15.3% |
| Immigrants | Senegal | 0.0 /100 | #298 | Tragic 15.3% |
| Senegalese | 0.0 /100 | #299 | Tragic 15.3% |
Demographics Similar to Sub-Saharan Africans by Poverty
In terms of poverty, the demographic groups most similar to Sub-Saharan Africans are Iroquois (14.5%, a difference of 0.040%), Immigrants from Cuba (14.6%, a difference of 0.15%), Central American (14.6%, a difference of 0.29%), Guyanese (14.5%, a difference of 0.35%), and Immigrants from Guyana (14.5%, a difference of 0.52%).
| Demographics | Rating | Rank | Poverty |
| Cherokee | 0.1 /100 | #261 | Tragic 14.4% |
| Immigrants | Liberia | 0.1 /100 | #262 | Tragic 14.4% |
| Jamaicans | 0.1 /100 | #263 | Tragic 14.4% |
| Immigrants | Jamaica | 0.1 /100 | #264 | Tragic 14.4% |
| Immigrants | Guyana | 0.1 /100 | #265 | Tragic 14.5% |
| Guyanese | 0.1 /100 | #266 | Tragic 14.5% |
| Iroquois | 0.1 /100 | #267 | Tragic 14.5% |
| Sub-Saharan Africans | 0.1 /100 | #268 | Tragic 14.5% |
| Immigrants | Cuba | 0.1 /100 | #269 | Tragic 14.6% |
| Central Americans | 0.1 /100 | #270 | Tragic 14.6% |
| Shoshone | 0.0 /100 | #271 | Tragic 14.7% |
| Chickasaw | 0.0 /100 | #272 | Tragic 14.7% |
| Spanish Americans | 0.0 /100 | #273 | Tragic 14.7% |
| Barbadians | 0.0 /100 | #274 | Tragic 14.8% |
| Immigrants | West Indies | 0.0 /100 | #275 | Tragic 14.8% |