Immigrants from Somalia vs Taiwanese Married-Couple Family Poverty

COMPARE

Immigrants from Somalia
Race
Ancestry
AfghanAfricanAlaska NativeAlaskan AthabascanAlbanianAleutAlsatianAmericanApacheArabArapahoArgentineanArmenianAssyrian/Chaldean/SyriacAustralianAustrianBahamianBangladeshiBarbadianBasqueBelgianBelizeanBermudanBhutaneseBlackfeetBolivianBrazilianBritishBritish West IndianBulgarianBurmeseCajunCambodianCanadianCape VerdeanCarpatho RusynCelticCentral AmericanCentral American IndianCherokeeCheyenneChickasawChileanChineseChippewaChoctawColombianColvilleComancheCosta RicanCreeCreekCroatianCrowCubanCypriotCzechCzechoslovakianDanishDelawareDominicanDutchDutch West IndianEastern EuropeanEcuadorianEgyptianEnglishEstonianEthiopianEuropeanFijianFilipinoFinnishFrenchFrench American IndianFrench CanadianGermanGerman RussianGhanaianGreekGuamanian/ChamorroGuatemalanGuyaneseHaitianHmongHonduranHopiHoumaHungarianIcelanderIndian (Asian)IndonesianInupiatIranianIraqiIrishIroquoisIsraeliItalianJamaicanJapaneseJordanianKenyanKiowaKoreanLaotianLatvianLebaneseLiberianLithuanianLumbeeLuxembourgerMacedonianMalaysianMalteseMarshalleseMenomineeMexicanMexican American IndianMongolianMoroccanNative HawaiianNavajoNepaleseNew ZealanderNicaraguanNigerianNorthern EuropeanNorwegianOkinawanOsageOttawaPaiutePakistaniPalestinianPanamanianParaguayanPennsylvania GermanPeruvianPimaPolishPortuguesePotawatomiPuebloPuerto RicanPuget Sound SalishRomanianRussianSalvadoranSamoanScandinavianScotch-IrishScottishSeminoleSenegaleseSerbianShoshoneSierra LeoneanSiouxSlavicSlovakSloveneSomaliSouth AfricanSouth AmericanSouth American IndianSoviet UnionSpaniardSpanishSpanish AmericanSpanish American IndianSri LankanSubsaharan AfricanSudaneseSwedishSwissSyrianThaiTlingit-HaidaTohono O'OdhamTonganTrinidadian and TobagonianTsimshianTurkishU.S. Virgin IslanderUgandanUkrainianUruguayanUteVenezuelanVietnameseWelshWest IndianYakamaYaquiYugoslavianYumanYup'ikZimbabwean
Immigration
NonimmigrantsImmigrantsAfghanistanAfricaAlbaniaArgentinaArmeniaAsiaAustraliaAustriaBahamasBangladeshBarbadosBelarusBelgiumBelizeBoliviaBosnia and HerzegovinaBrazilBulgariaBurma/MyanmarCabo VerdeCambodiaCameroonCanadaCaribbeanCentral AmericaChileChinaColombiaCongoCosta RicaCroatiaCubaCzechoslovakiaDenmarkDominicaDominican RepublicEastern AfricaEastern AsiaEastern EuropeEcuadorEgyptEl SalvadorEnglandEritreaEthiopiaEuropeFijiFranceGermanyGhanaGreeceGrenadaGuatemalaGuyanaHaitiHondurasHong KongHungaryIndiaIndonesiaIranIraqIrelandIsraelItalyJamaicaJapanJordanKazakhstanKenyaKoreaKuwaitLaosLatin AmericaLatviaLebanonLiberiaLithuaniaMalaysiaMexicoMicronesiaMiddle AfricaMoldovaMoroccoNepalNetherlandsNicaraguaNigeriaNorth AmericaNorth MacedoniaNorthern AfricaNorthern EuropeNorwayOceaniaPakistanPanamaPeruPhilippinesPolandPortugalRomaniaRussiaSaudi ArabiaScotlandSenegalSerbiaSierra LeoneSingaporeSomaliaSouth AfricaSouth AmericaSouth Central AsiaSouth Eastern AsiaSouthern EuropeSpainSri LankaSt. Vincent and the GrenadinesSudanSwedenSwitzerlandSyriaTaiwanThailandTrinidad and TobagoTurkeyUgandaUkraineUruguayUzbekistanVenezuelaVietnamWest IndiesWestern AfricaWestern AsiaWestern EuropeYemenZaireZimbabweAzores
Taiwanese
Race
Ancestry
AfghanAfricanAlaska NativeAlaskan AthabascanAlbanianAleutAlsatianAmericanApacheArabArapahoArgentineanArmenianAssyrian/Chaldean/SyriacAustralianAustrianBahamianBangladeshiBarbadianBasqueBelgianBelizeanBermudanBhutaneseBlackfeetBolivianBrazilianBritishBritish West IndianBulgarianBurmeseCajunCambodianCanadianCape VerdeanCarpatho RusynCelticCentral AmericanCentral American IndianCherokeeCheyenneChickasawChileanChineseChippewaChoctawColombianColvilleComancheCosta RicanCreeCreekCroatianCrowCubanCypriotCzechCzechoslovakianDanishDelawareDominicanDutchDutch West IndianEastern EuropeanEcuadorianEgyptianEnglishEstonianEthiopianEuropeanFijianFilipinoFinnishFrenchFrench American IndianFrench CanadianGermanGerman RussianGhanaianGreekGuamanian/ChamorroGuatemalanGuyaneseHaitianHmongHonduranHopiHoumaHungarianIcelanderIndian (Asian)IndonesianInupiatIranianIraqiIrishIroquoisIsraeliItalianJamaicanJapaneseJordanianKenyanKiowaKoreanLaotianLatvianLebaneseLiberianLithuanianLumbeeLuxembourgerMacedonianMalaysianMalteseMarshalleseMenomineeMexicanMexican American IndianMongolianMoroccanNative HawaiianNavajoNepaleseNew ZealanderNicaraguanNigerianNorthern EuropeanNorwegianOkinawanOsageOttawaPaiutePakistaniPalestinianPanamanianParaguayanPennsylvania GermanPeruvianPimaPolishPortuguesePotawatomiPuebloPuerto RicanPuget Sound SalishRomanianRussianSalvadoranSamoanScandinavianScotch-IrishScottishSeminoleSenegaleseSerbianShoshoneSierra LeoneanSiouxSlavicSlovakSloveneSomaliSouth AfricanSouth AmericanSouth American IndianSoviet UnionSpaniardSpanishSpanish AmericanSpanish American IndianSri LankanSubsaharan AfricanSudaneseSwedishSwissSyrianTaiwaneseThaiTlingit-HaidaTohono O'OdhamTonganTrinidadian and TobagonianTsimshianTurkishU.S. Virgin IslanderUgandanUkrainianUruguayanUteVenezuelanVietnameseWelshWest IndianYakamaYaquiYugoslavianYumanYup'ikZimbabwean
Immigration
NonimmigrantsImmigrantsAfghanistanAfricaAlbaniaArgentinaArmeniaAsiaAustraliaAustriaBahamasBangladeshBarbadosBelarusBelgiumBelizeBoliviaBosnia and HerzegovinaBrazilBulgariaBurma/MyanmarCabo VerdeCambodiaCameroonCanadaCaribbeanCentral AmericaChileChinaColombiaCongoCosta RicaCroatiaCubaCzechoslovakiaDenmarkDominicaDominican RepublicEastern AfricaEastern AsiaEastern EuropeEcuadorEgyptEl SalvadorEnglandEritreaEthiopiaEuropeFijiFranceGermanyGhanaGreeceGrenadaGuatemalaGuyanaHaitiHondurasHong KongHungaryIndiaIndonesiaIranIraqIrelandIsraelItalyJamaicaJapanJordanKazakhstanKenyaKoreaKuwaitLaosLatin AmericaLatviaLebanonLiberiaLithuaniaMalaysiaMexicoMicronesiaMiddle AfricaMoldovaMoroccoNepalNetherlandsNicaraguaNigeriaNorth AmericaNorth MacedoniaNorthern AfricaNorthern EuropeNorwayOceaniaPakistanPanamaPeruPhilippinesPolandPortugalRomaniaRussiaSaudi ArabiaScotlandSenegalSerbiaSierra LeoneSingaporeSouth AfricaSouth AmericaSouth Central AsiaSouth Eastern AsiaSouthern EuropeSpainSri LankaSt. Vincent and the GrenadinesSudanSwedenSwitzerlandSyriaTaiwanThailandTrinidad and TobagoTurkeyUgandaUkraineUruguayUzbekistanVenezuelaVietnamWest IndiesWestern AfricaWestern AsiaWestern EuropeYemenZaireZimbabweAzores
Married-Couple Family Poverty
Income
Poverty
Unemployment
Labor Participation
Family Structure
Vehicle Availability
Education Level
Disability

Married-Couple Family Poverty Comparison

Immigrants from Somalia

Taiwanese

Tragic
Exceptional
6.0%
MARRIED-COUPLE FAMILY POVERTY
0.7/ 100
METRIC RATING
254th/ 347
METRIC RANK
4.8%
MARRIED-COUPLE FAMILY POVERTY
94.8/ 100
METRIC RATING
115th/ 347
METRIC RANK

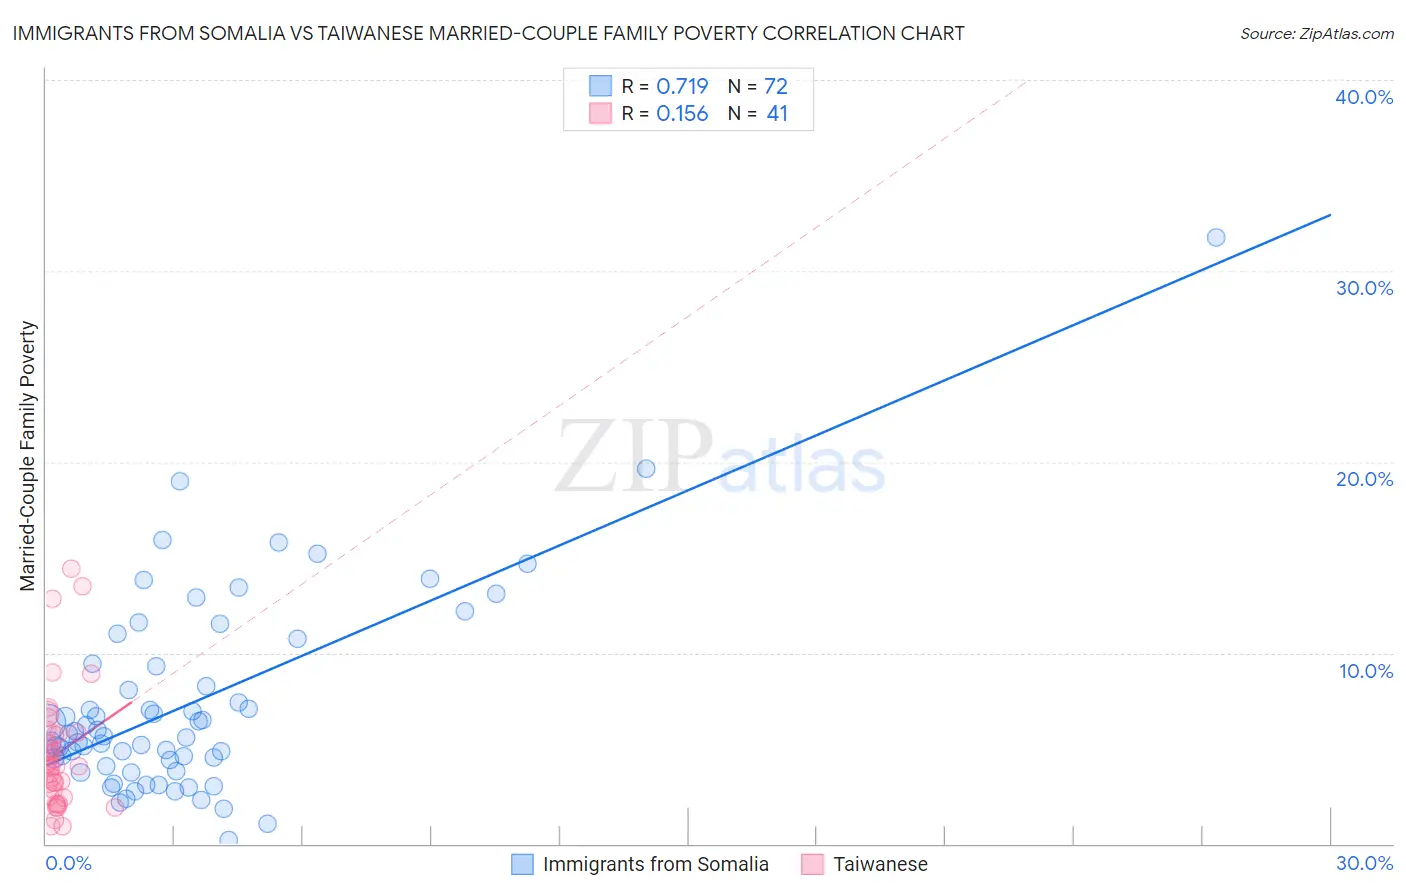
Immigrants from Somalia vs Taiwanese Married-Couple Family Poverty Correlation Chart

The statistical analysis conducted on geographies consisting of 91,930,592 people shows a strong positive correlation between the proportion of Immigrants from Somalia and poverty level among married-couple families in the United States with a correlation coefficient (R) of 0.719 and weighted average of 6.0%. Similarly, the statistical analysis conducted on geographies consisting of 31,702,060 people shows a poor positive correlation between the proportion of Taiwanese and poverty level among married-couple families in the United States with a correlation coefficient (R) of 0.156 and weighted average of 4.8%, a difference of 24.9%.
Immigrants from Somalia vs Taiwanese Married-Couple Family Poverty

Married-Couple Family Poverty Correlation Summary

MeasurementImmigrants from SomaliaTaiwanese
Minimum0.17%0.94%
Maximum31.7%14.4%
Range31.6%13.5%
Mean7.3%4.7%
Median5.7%4.1%
Interquartile 25% (IQ1)4.3%2.4%
Interquartile 75% (IQ3)9.4%5.8%
Interquartile Range (IQR)5.1%3.3%
Standard Deviation (Sample)5.2%3.2%
Standard Deviation (Population)5.2%3.1%

Similar Demographics by Married-Couple Family Poverty

Demographics Similar to Immigrants from Somalia by Married-Couple Family Poverty

In terms of married-couple family poverty, the demographic groups most similar to Immigrants from Somalia are African (6.0%, a difference of 0.060%), Immigrants from Western Asia (6.0%, a difference of 0.15%), Comanche (6.0%, a difference of 0.15%), Bangladeshi (6.0%, a difference of 0.65%), and Immigrants from Ghana (5.9%, a difference of 0.79%).
DemographicsRating | RankMarried-Couple Family Poverty
Iraqis
1.4
/100
|
#247
Tragic
5.9%
Cree
1.2
/100
|
#248
Tragic
5.9%
Tsimshian
1.1
/100
|
#249
Tragic
5.9%
Immigrants | Eritrea
1.1
/100
|
#250
Tragic
5.9%
Immigrants | Ghana
1.0
/100
|
#251
Tragic
5.9%
Immigrants | Western Asia
0.7
/100
|
#252
Tragic
6.0%
Africans
0.7
/100
|
#253
Tragic
6.0%
Immigrants | Somalia
0.7
/100
|
#254
Tragic
6.0%
Comanche
0.7
/100
|
#255
Tragic
6.0%
Bangladeshis
0.5
/100
|
#256
Tragic
6.0%
Immigrants | Burma/Myanmar
0.5
/100
|
#257
Tragic
6.0%
Immigrants | Immigrants
0.5
/100
|
#258
Tragic
6.0%
Alaskan Athabascans
0.4
/100
|
#259
Tragic
6.1%
Jamaicans
0.3
/100
|
#260
Tragic
6.1%
Senegalese
0.3
/100
|
#261
Tragic
6.1%

Demographics Similar to Taiwanese by Married-Couple Family Poverty

In terms of married-couple family poverty, the demographic groups most similar to Taiwanese are Celtic (4.8%, a difference of 0.010%), Kenyan (4.8%, a difference of 0.11%), Immigrants from Philippines (4.8%, a difference of 0.13%), Immigrants from Indonesia (4.8%, a difference of 0.15%), and Immigrants from Eastern Asia (4.8%, a difference of 0.50%).
DemographicsRating | RankMarried-Couple Family Poverty
Laotians
96.6
/100
|
#108
Exceptional
4.7%
Immigrants | Hong Kong
96.4
/100
|
#109
Exceptional
4.7%
Immigrants | Bolivia
96.2
/100
|
#110
Exceptional
4.7%
Pakistanis
96.2
/100
|
#111
Exceptional
4.7%
Tongans
95.9
/100
|
#112
Exceptional
4.7%
Immigrants | Nepal
95.9
/100
|
#113
Exceptional
4.7%
Immigrants | Indonesia
95.1
/100
|
#114
Exceptional
4.8%
Taiwanese
94.8
/100
|
#115
Exceptional
4.8%
Celtics
94.8
/100
|
#116
Exceptional
4.8%
Kenyans
94.7
/100
|
#117
Exceptional
4.8%
Immigrants | Philippines
94.6
/100
|
#118
Exceptional
4.8%
Immigrants | Eastern Asia
94.0
/100
|
#119
Exceptional
4.8%
Immigrants | Southern Europe
93.4
/100
|
#120
Exceptional
4.8%
Indians (Asian)
93.2
/100
|
#121
Exceptional
4.8%
Whites/Caucasians
93.1
/100
|
#122
Exceptional
4.8%