Immigrants from Ireland vs Immigrants from Peru Poverty
COMPARE
Immigrants from Ireland
Immigrants from Peru
Poverty
Poverty Comparison
Immigrants from Ireland
Immigrants from Peru
10.1%
POVERTY
99.9/ 100
METRIC RATING
5th/ 347
METRIC RANK
11.9%
POVERTY
81.1/ 100
METRIC RATING
140th/ 347
METRIC RANK
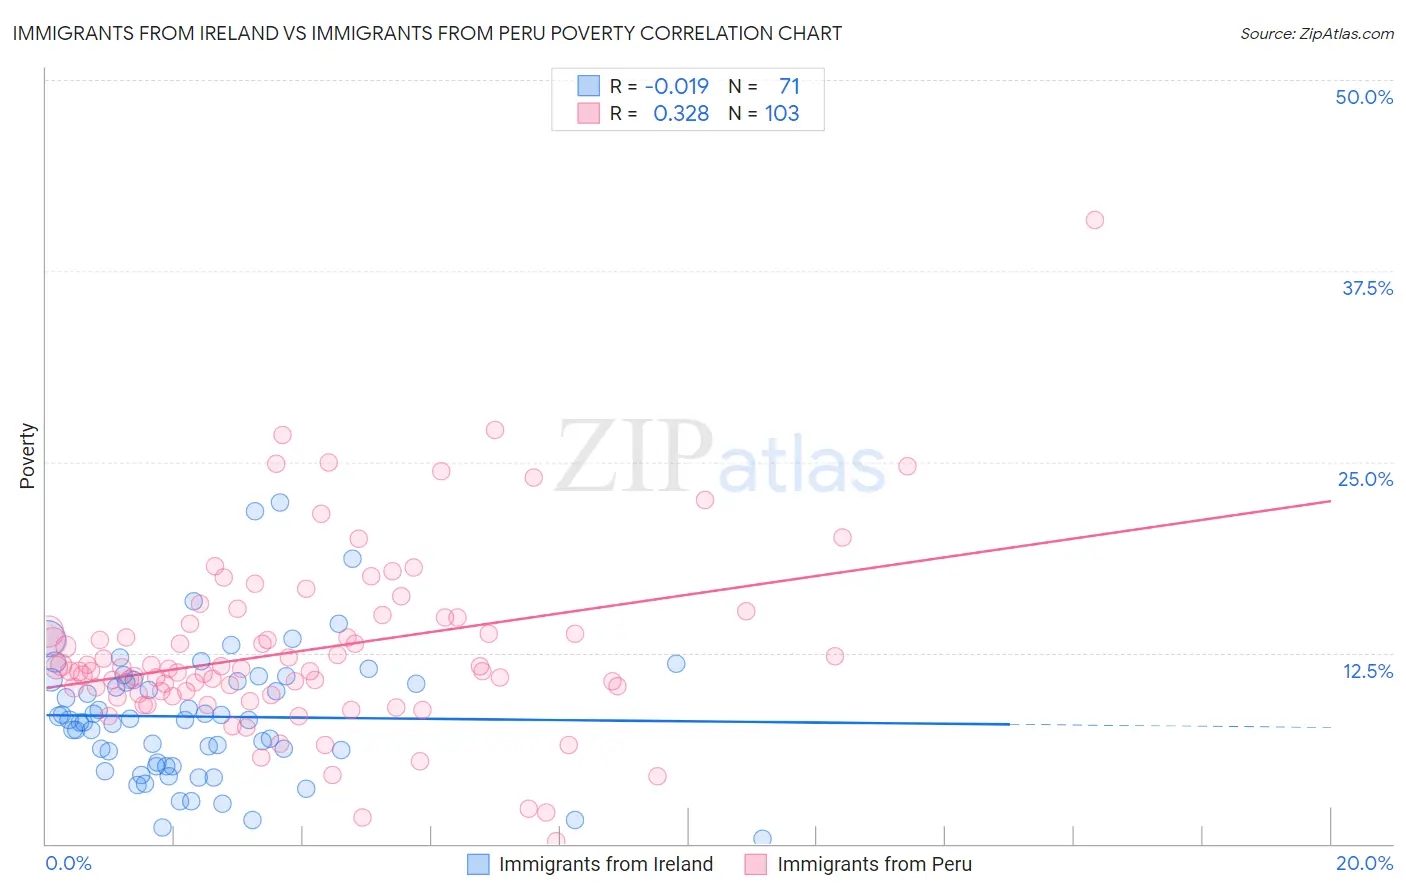
Immigrants from Ireland vs Immigrants from Peru Poverty Correlation Chart
The statistical analysis conducted on geographies consisting of 240,745,110 people shows no correlation between the proportion of Immigrants from Ireland and poverty level in the United States with a correlation coefficient (R) of -0.019 and weighted average of 10.1%. Similarly, the statistical analysis conducted on geographies consisting of 328,758,820 people shows a mild positive correlation between the proportion of Immigrants from Peru and poverty level in the United States with a correlation coefficient (R) of 0.328 and weighted average of 11.9%, a difference of 17.8%.
Poverty Correlation Summary
| Measurement | Immigrants from Ireland | Immigrants from Peru |
| Minimum | 0.31% | 0.14% |
| Maximum | 22.3% | 40.8% |
| Range | 22.0% | 40.7% |
| Mean | 8.3% | 12.7% |
| Median | 8.1% | 11.4% |
| Interquartile 25% (IQ1) | 5.1% | 9.8% |
| Interquartile 75% (IQ3) | 10.7% | 14.8% |
| Interquartile Range (IQR) | 5.6% | 5.0% |
| Standard Deviation (Sample) | 4.3% | 5.9% |
| Standard Deviation (Population) | 4.3% | 5.9% |
Similar Demographics by Poverty
Demographics Similar to Immigrants from Ireland by Poverty
In terms of poverty, the demographic groups most similar to Immigrants from Ireland are Assyrian/Chaldean/Syriac (10.1%, a difference of 0.18%), Filipino (10.1%, a difference of 0.32%), Maltese (10.2%, a difference of 0.74%), Immigrants from South Central Asia (10.2%, a difference of 1.2%), and Bulgarian (10.2%, a difference of 1.6%).
| Demographics | Rating | Rank | Poverty |
| Immigrants | India | 100.0 /100 | #1 | Exceptional 9.0% |
| Chinese | 100.0 /100 | #2 | Exceptional 9.5% |
| Thais | 100.0 /100 | #3 | Exceptional 9.6% |
| Immigrants | Taiwan | 100.0 /100 | #4 | Exceptional 9.7% |
| Immigrants | Ireland | 99.9 /100 | #5 | Exceptional 10.1% |
| Assyrians/Chaldeans/Syriacs | 99.9 /100 | #6 | Exceptional 10.1% |
| Filipinos | 99.9 /100 | #7 | Exceptional 10.1% |
| Maltese | 99.9 /100 | #8 | Exceptional 10.2% |
| Immigrants | South Central Asia | 99.9 /100 | #9 | Exceptional 10.2% |
| Bulgarians | 99.9 /100 | #10 | Exceptional 10.2% |
| Immigrants | Lithuania | 99.9 /100 | #11 | Exceptional 10.3% |
| Bhutanese | 99.8 /100 | #12 | Exceptional 10.4% |
| Immigrants | Hong Kong | 99.8 /100 | #13 | Exceptional 10.4% |
| Immigrants | Bolivia | 99.8 /100 | #14 | Exceptional 10.4% |
| Bolivians | 99.8 /100 | #15 | Exceptional 10.4% |
Demographics Similar to Immigrants from Peru by Poverty
In terms of poverty, the demographic groups most similar to Immigrants from Peru are Immigrants from France (11.9%, a difference of 0.090%), Basque (11.9%, a difference of 0.11%), Pakistani (11.9%, a difference of 0.19%), Immigrants from Jordan (11.9%, a difference of 0.22%), and Brazilian (11.9%, a difference of 0.22%).
| Demographics | Rating | Rank | Poverty |
| Immigrants | Western Europe | 85.2 /100 | #133 | Excellent 11.8% |
| Yugoslavians | 85.2 /100 | #134 | Excellent 11.8% |
| Immigrants | Vietnam | 85.2 /100 | #135 | Excellent 11.8% |
| Chileans | 84.2 /100 | #136 | Excellent 11.8% |
| Immigrants | Switzerland | 83.0 /100 | #137 | Excellent 11.8% |
| Immigrants | Jordan | 82.4 /100 | #138 | Excellent 11.9% |
| Pakistanis | 82.2 /100 | #139 | Excellent 11.9% |
| Immigrants | Peru | 81.1 /100 | #140 | Excellent 11.9% |
| Immigrants | France | 80.5 /100 | #141 | Excellent 11.9% |
| Basques | 80.4 /100 | #142 | Excellent 11.9% |
| Brazilians | 79.7 /100 | #143 | Good 11.9% |
| Icelanders | 77.9 /100 | #144 | Good 11.9% |
| Syrians | 75.1 /100 | #145 | Good 12.0% |
| Afghans | 74.9 /100 | #146 | Good 12.0% |
| Immigrants | Bosnia and Herzegovina | 73.7 /100 | #147 | Good 12.0% |