Inupiat vs Immigrants from Peru Poverty
COMPARE
Inupiat
Immigrants from Peru
Poverty
Poverty Comparison
Inupiat
Immigrants from Peru
15.1%
POVERTY
0.0/ 100
METRIC RATING
287th/ 347
METRIC RANK
11.9%
POVERTY
81.1/ 100
METRIC RATING
140th/ 347
METRIC RANK
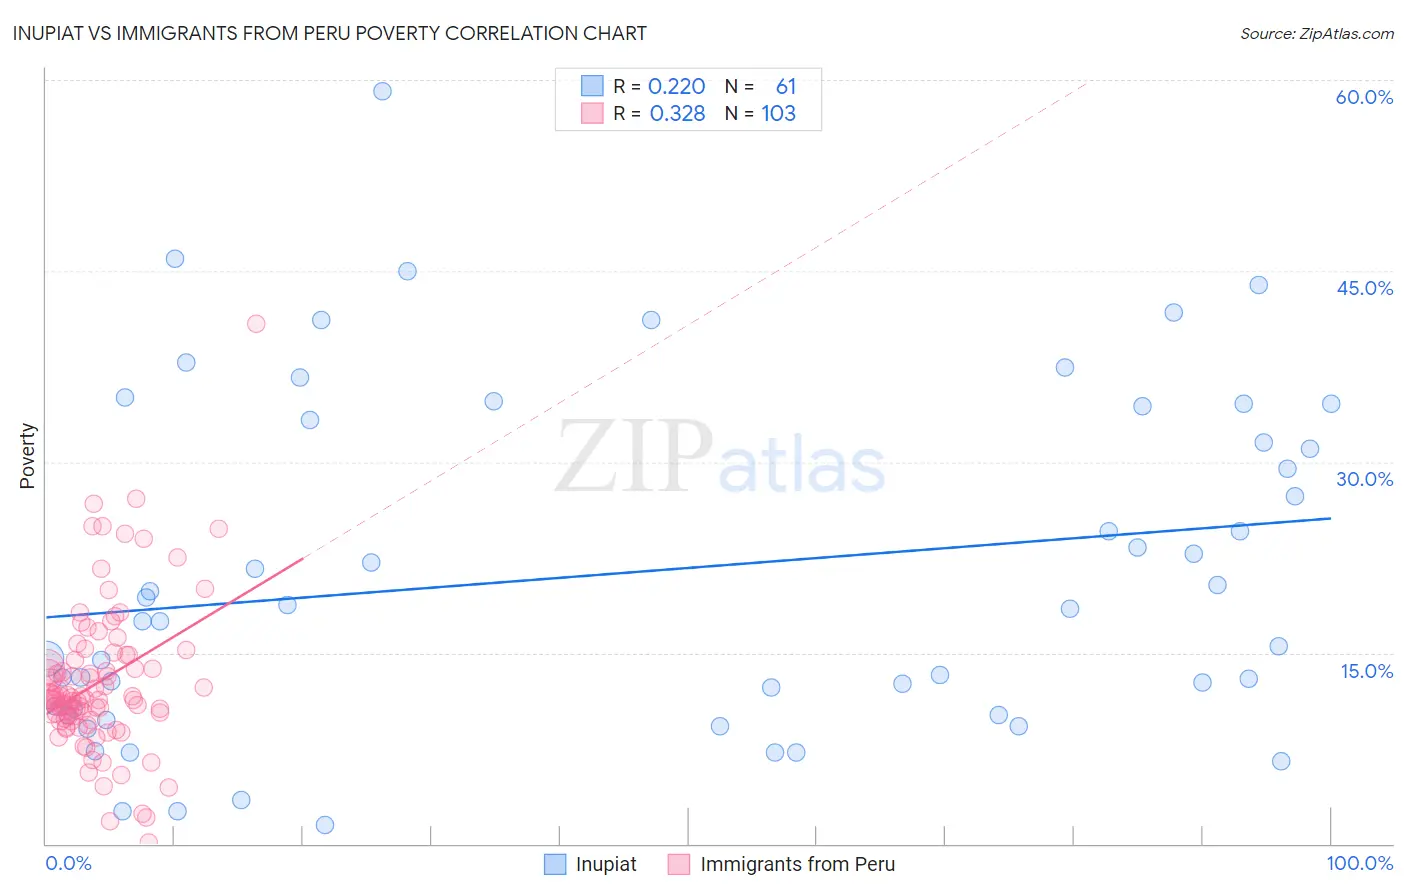
Inupiat vs Immigrants from Peru Poverty Correlation Chart
The statistical analysis conducted on geographies consisting of 96,319,332 people shows a weak positive correlation between the proportion of Inupiat and poverty level in the United States with a correlation coefficient (R) of 0.220 and weighted average of 15.1%. Similarly, the statistical analysis conducted on geographies consisting of 328,758,820 people shows a mild positive correlation between the proportion of Immigrants from Peru and poverty level in the United States with a correlation coefficient (R) of 0.328 and weighted average of 11.9%, a difference of 26.8%.
Poverty Correlation Summary
| Measurement | Inupiat | Immigrants from Peru |
| Minimum | 1.4% | 0.14% |
| Maximum | 59.1% | 40.8% |
| Range | 57.7% | 40.7% |
| Mean | 21.3% | 12.7% |
| Median | 18.4% | 11.4% |
| Interquartile 25% (IQ1) | 10.3% | 9.8% |
| Interquartile 75% (IQ3) | 33.9% | 14.8% |
| Interquartile Range (IQR) | 23.5% | 5.0% |
| Standard Deviation (Sample) | 13.3% | 5.9% |
| Standard Deviation (Population) | 13.2% | 5.9% |
Similar Demographics by Poverty
Demographics Similar to Inupiat by Poverty
In terms of poverty, the demographic groups most similar to Inupiat are Yaqui (15.1%, a difference of 0.010%), Immigrants from Belize (15.1%, a difference of 0.13%), Immigrants from Latin America (15.0%, a difference of 0.21%), Mexican (15.1%, a difference of 0.23%), and Immigrants from Cabo Verde (15.1%, a difference of 0.36%).
| Demographics | Rating | Rank | Poverty |
| Haitians | 0.0 /100 | #280 | Tragic 14.9% |
| Immigrants | Barbados | 0.0 /100 | #281 | Tragic 14.9% |
| Comanche | 0.0 /100 | #282 | Tragic 15.0% |
| Immigrants | Haiti | 0.0 /100 | #283 | Tragic 15.0% |
| West Indians | 0.0 /100 | #284 | Tragic 15.0% |
| Vietnamese | 0.0 /100 | #285 | Tragic 15.0% |
| Immigrants | Latin America | 0.0 /100 | #286 | Tragic 15.0% |
| Inupiat | 0.0 /100 | #287 | Tragic 15.1% |
| Yaqui | 0.0 /100 | #288 | Tragic 15.1% |
| Immigrants | Belize | 0.0 /100 | #289 | Tragic 15.1% |
| Mexicans | 0.0 /100 | #290 | Tragic 15.1% |
| Immigrants | Cabo Verde | 0.0 /100 | #291 | Tragic 15.1% |
| Indonesians | 0.0 /100 | #292 | Tragic 15.1% |
| Immigrants | Zaire | 0.0 /100 | #293 | Tragic 15.1% |
| Blackfeet | 0.0 /100 | #294 | Tragic 15.2% |
Demographics Similar to Immigrants from Peru by Poverty
In terms of poverty, the demographic groups most similar to Immigrants from Peru are Immigrants from France (11.9%, a difference of 0.090%), Basque (11.9%, a difference of 0.11%), Pakistani (11.9%, a difference of 0.19%), Immigrants from Jordan (11.9%, a difference of 0.22%), and Brazilian (11.9%, a difference of 0.22%).
| Demographics | Rating | Rank | Poverty |
| Immigrants | Western Europe | 85.2 /100 | #133 | Excellent 11.8% |
| Yugoslavians | 85.2 /100 | #134 | Excellent 11.8% |
| Immigrants | Vietnam | 85.2 /100 | #135 | Excellent 11.8% |
| Chileans | 84.2 /100 | #136 | Excellent 11.8% |
| Immigrants | Switzerland | 83.0 /100 | #137 | Excellent 11.8% |
| Immigrants | Jordan | 82.4 /100 | #138 | Excellent 11.9% |
| Pakistanis | 82.2 /100 | #139 | Excellent 11.9% |
| Immigrants | Peru | 81.1 /100 | #140 | Excellent 11.9% |
| Immigrants | France | 80.5 /100 | #141 | Excellent 11.9% |
| Basques | 80.4 /100 | #142 | Excellent 11.9% |
| Brazilians | 79.7 /100 | #143 | Good 11.9% |
| Icelanders | 77.9 /100 | #144 | Good 11.9% |
| Syrians | 75.1 /100 | #145 | Good 12.0% |
| Afghans | 74.9 /100 | #146 | Good 12.0% |
| Immigrants | Bosnia and Herzegovina | 73.7 /100 | #147 | Good 12.0% |